6th Math Day 2 Unit 8 Lesson 17
star
star
star
star
star
Last updated about 6 years ago
6 Nsɛmmisa

1
1. Write the five-number summary for the data for each airplane. Then calculate the interquartile range for each data set.
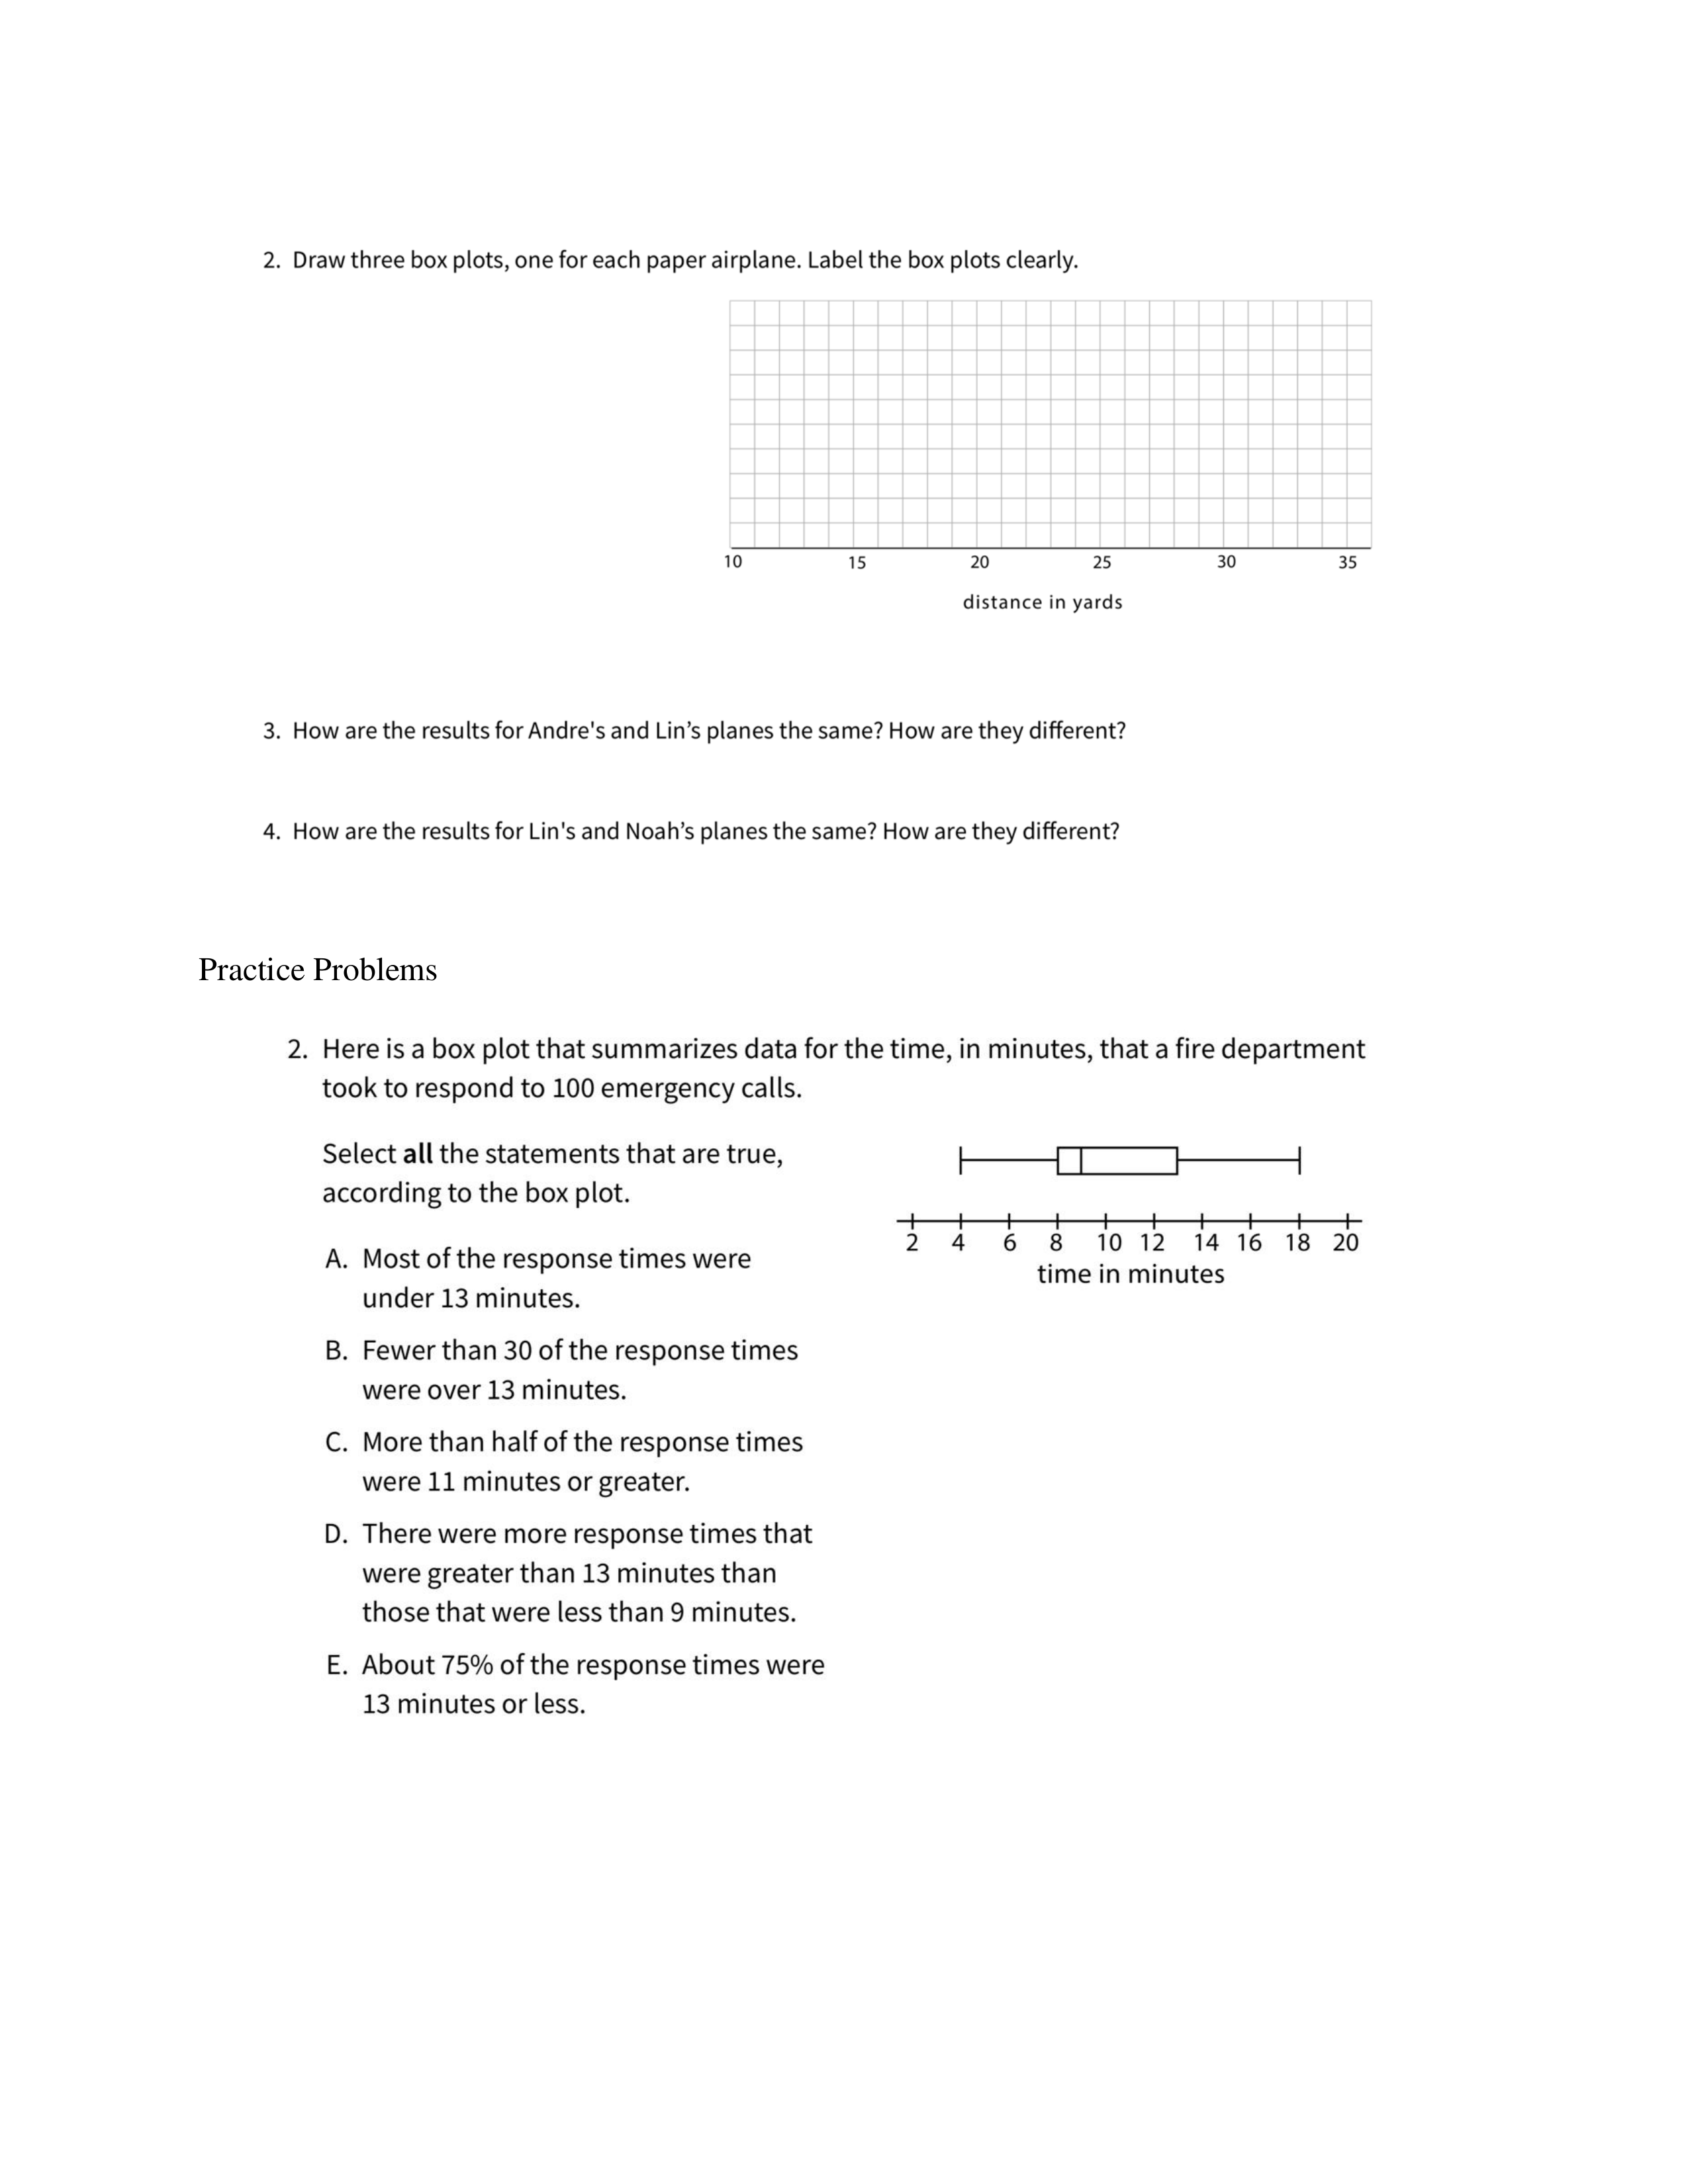
2. Draw three box plots, one for each paper airplane. Label the box plots clearly.
1. Write the five-number summary for the data for each airplane. Then calculate the interquartile range for each data set.
2. Draw three box plots, one for each paper airplane. Label the box plots clearly.