This is part of a six lesson series adapted from OpenSciEd.
1 point
1
Question 1
1.
Pre-assessment - Make sure not to hurt your ears
Change the settings on the pitch and loudness.
Describe what these are in everyday language.
"The loudness is..."
"The pictch is..."
1 point
1
1 point
1
Question 3
3.
Absorb
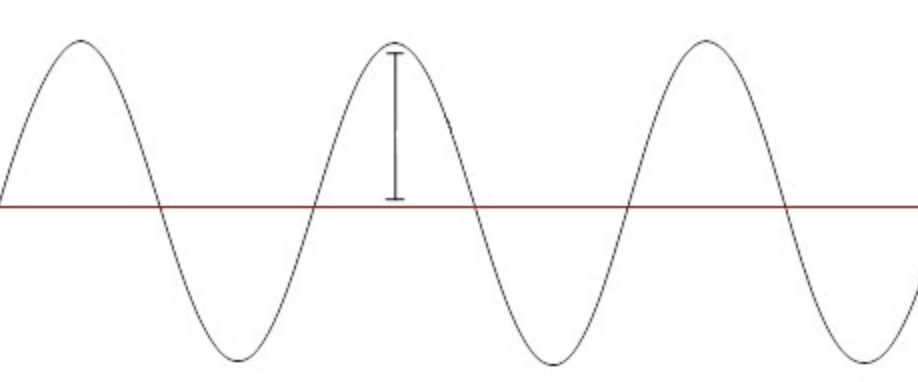
Copy the following notes into your science journal. NOTICE the starting position just like the model we drew from our instruments last class.
We will be adding to this in the coming days so please keep it handy.
Take a photo of your notes from class.
1 point
1
Question 4
4.
The graphs on the left below are of the motion of the ruler when analyzed by a motion detector. The graphs on the right are from the website you used above.
Compare how the graphs are similar below. The "stick" is your ruler.
Read the graph outloud - what is the x-axis, y-axis and what is it showing. Take turns with each person reading a graph outloud. (This should sound like, "The graph of the left is titled Stick Soft Push - it's x-axis is position (no units but since this is the ruler we might be thinking milimeters or mm.")
1 point
1
Question 5
5.
Check-In
What claim can we make about sound, vibration and energy based on these graphs?
1 point
1
Question 6
6.
1 point
1
Question 7
7.
1 point
1
Question 8
8.
1 point
1
Question 9
9.
1 point
1
Question 10
10.
Reflect
How could we change our ruler "instrument" to model how else sounds are different? Think about other ways to position it on the counter. Play around with your ruler and then describe it below. Be sure not to break it!
1 point
1
Question 11
11.
Optional Extension
Watch the following video. How is it similar to the ruler?