Find and interpret the mean absolute deviation of the data. Round your answer to the nearest tenth, if necessary.
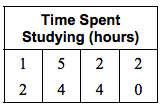
Find and interpret the mean absolute deviation of the data. Round your answer to the nearest tenth, if necessary.
Find the range of the data:
14, 18, 16, 17, 18, 17
Find the range of the data:
87, 56, 121, 91, 62, 108, 50
Find the median, first quartile, third quartile, and interquartile range of the data:
12, 31, 9, 20, 36, 5, 22
Find the median, first quartile, third quartile, and interquartile range of the data:
63, 68, 58, 77, 50, 49, 63, 73
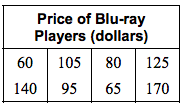
Find and interpret the mean absolute deviation of the data. Round your answer to the nearest tenth, if necessary.
Find and interpret the mean absolute deviation of the data. Round your answer to the nearest tenth, if necessary.
The table shows the minutes played by 12 hockey players in one game.
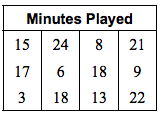
a. Find the range and interquartile range of the data.
b. goalie who played the entire 60 minutes of the game is added to the data set. Is 60 an outlier? How does adding this value to the data set affect the measures in part (a)?
The data sets show the daily number of miles Eric drives during two different weeks. Eric moved closer to work at the end of Week 1.
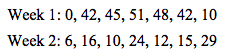
a. Find the measures of center and the measures of variation for each data set.
b. Compare the measures. What can you conclude?