Acceleration Introduction
star
star
star
star
star
Last updated about 6 years ago
13 Nsɛmmisa
Hyɛ no nsow a efi ɔkyerɛwfo no hɔ:
Students are introduced to the concept of acceleration, make graphs, and answer questions

1
1
1
1
1
1
1
1
1
1
1
1
1
Students are introduced to the concept of acceleration, make graphs, and answer questions
Imagine you are driving a car and want to merge onto the freeway. Traffic is moving fast, and you only have a few seconds to speed up to the pace of the other cars. You step on the gas, but your car is old and doesn't have much power. You know your car can get up to the freeway speed (60 miles per hour), but how long will it take?
What you need to know is your car's maximum acceleration. How long does it take to go from a stop (0 mph) to 60 mph? A Ferrari can do that in 2.4 seconds. A Toyota Camry takes longer, 7.6 seconds, to accelerate from 0 to 60 mph.
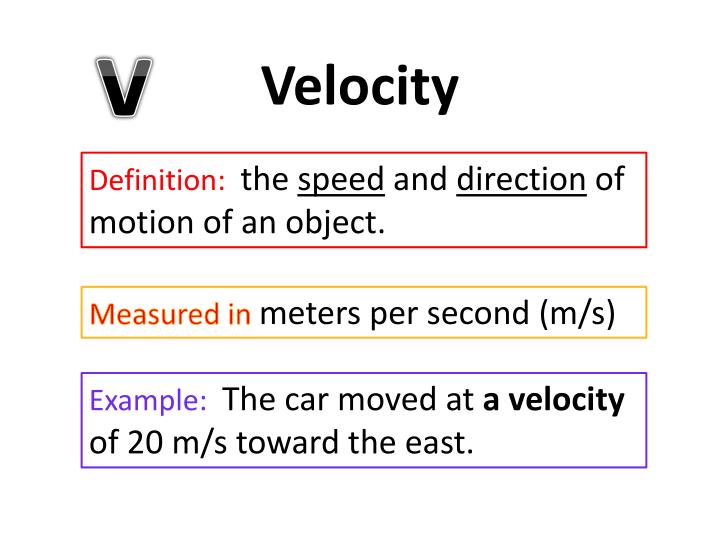
Speed is measured by units of distance/time, for example miles per hour (mph) or meters per second (m/s). Acceleration is the increase (or decrease) in speed per second. The most common unit used for acceleration is meters per second per second, or the change in speed (m/s) per second.
What does it feel like when you are accelerated quickly in a car? On a roller coaster? If you are trying to get up to freeway speed quickly, your car will need to increase its acceleration. To do that you would have to step on the gas.
The graph below shows the position a ball has travelled (in meters) as it rolls down a long ramp. The position is shown versus time in seconds. We will use this simple example to start exploring acceleration.
How many meters had the ball travelled after 2 seconds?
How many meters had the ball travelled after 4 seconds?
Compare the time periods 0-2 seconds and 2-4 seconds. Which statement is true?
Which statement best describes the ball's speed as it travells down the ramp?
Follow the steps below to make a distance versus time graph that plots the distance a ball has travelled in meters versus time in seconds as it rolls down a long ramp. Watch the video posted below this question if you need help.
Instructions to make your graph:
1) Insert a data table (click the plus sign at the top right then choose data table)
2) Change the top of the data table to t1 (for time, instead of x1) and d1 (for distance, instead of y).
3) In the data table, type in the following data points: (0,0), (1,1), (2, 4), (4, 16)
4) Click the plus sign again and insert a generic linear equation: d=at (which means distance equals a (a constant) multiplied by time).
5) A suggestion to add a slider for a should pop up, click on that option
6) move the slider bar for the a value. Are you able to make the line fit all the data points?
7) Looks like you can't make the line fit. Let's try another equation. Go back to the equation d=at and change it to d=at^2
8) Now try the a slider bar, does it fit now?
9) Use the a slider bar until the curve fits to your data.
Using the data from your above graph, calculate the average speed of the ball in its first second of travel. To do that, figure out its change in distance (how far it went between 0 and 1 seconds) and divide that by the change in time (1 second).
Using the data from your above graph, calculate the average speed of the ball between 1 and 2 seconds. To do that, figure out its change in distance (how many meters it travelled between 1 and 2 seconds) and divide that by the change in time (1 second). Another way to show that calculation is: Average speed = (distance 2 - distance 1) / (time 2 - time 1). Show your work.
Look at the slope, or steepness of the curve on your graph. What happens to the curve as time passes?
On a distance versus time graph, the slope (steepness) of the line or curve is actually the speed of the object. Given your answer above, what is happening to the speed of the ball as it travels down the ramp?
The above graph shows the distance a biker travels over time. Match three sections of the graph above with the description of the biker's motion during that time period.
| Draggable item | arrow_right_alt | Corresponding Item |
|---|---|---|
travelling at a constant speed | arrow_right_alt | A |
speeding up | arrow_right_alt | B |
stopped | arrow_right_alt | C |
Let's make a new kind of graph. Instead of plotting distance versus time, we will plot velocity versus time (similar to speed versus time but in one direction). Plot the data described in the following scenario:
Maria is going on a bike ride. She lives at the top of a hill. Starting at the top, she is stopped. She then gets on her bike and coasts to the bottom without using her brakes. At time 0 seconds, she is not moving. At 1 second (part way down the hill) she is going 1.5 meters per second (m/s), at 2 seconds she is going 3 meters per second, and at 4 seconds she is going 6 meters per second.
Instructions to make your graph:
1) Insert a data table (click the plus sign at the top right then choose data table)
2) Change the top of the data table to t1 (for time, instead of x1) and v1 (for velocity, instead of y).
3) In the data table, type in the following data points from Maria's bike ride as described above
4) Click the plus sign again and insert a generic linear equation: v=at (which means velocity equals a (a constant) multiplied by time).
5) A suggestion to add a slider for a should pop up, click on that option
6) move the slider bar for the a value. Are you able to make the line fit all the data points?
7) Zoom in or out by pinching your touch pad to put the points in view.
What is the slope of the line in your above graph? Calculate it and show your work. Remember that the formula for slope is rise/run, or the change in y divided by the change in x. Pick two points, for example (0,0) and (4,6) and calculate the slope.
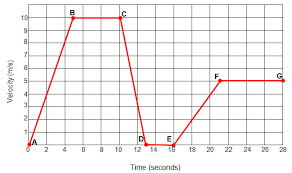
The above graph shows Maria's velocity along the first 28 seconds of her bike ride. For each line segment (for example Line AB is the line that connects points A and B), match the description for Maria's motion during the time that line represents.
| Draggable item | arrow_right_alt | Corresponding Item |
|---|---|---|
FG | arrow_right_alt | Accelerating from a stop to 10 m/s |
CD | arrow_right_alt | Constant velocity of 10 m/s |
DE | arrow_right_alt | Slowing (decellerating) from 10 m/s to a stop |
AB | arrow_right_alt | Not moving |
BC | arrow_right_alt | Accelerating from a stop to 5 m/s |
EF | arrow_right_alt | Constant velociy at 5 m/s |