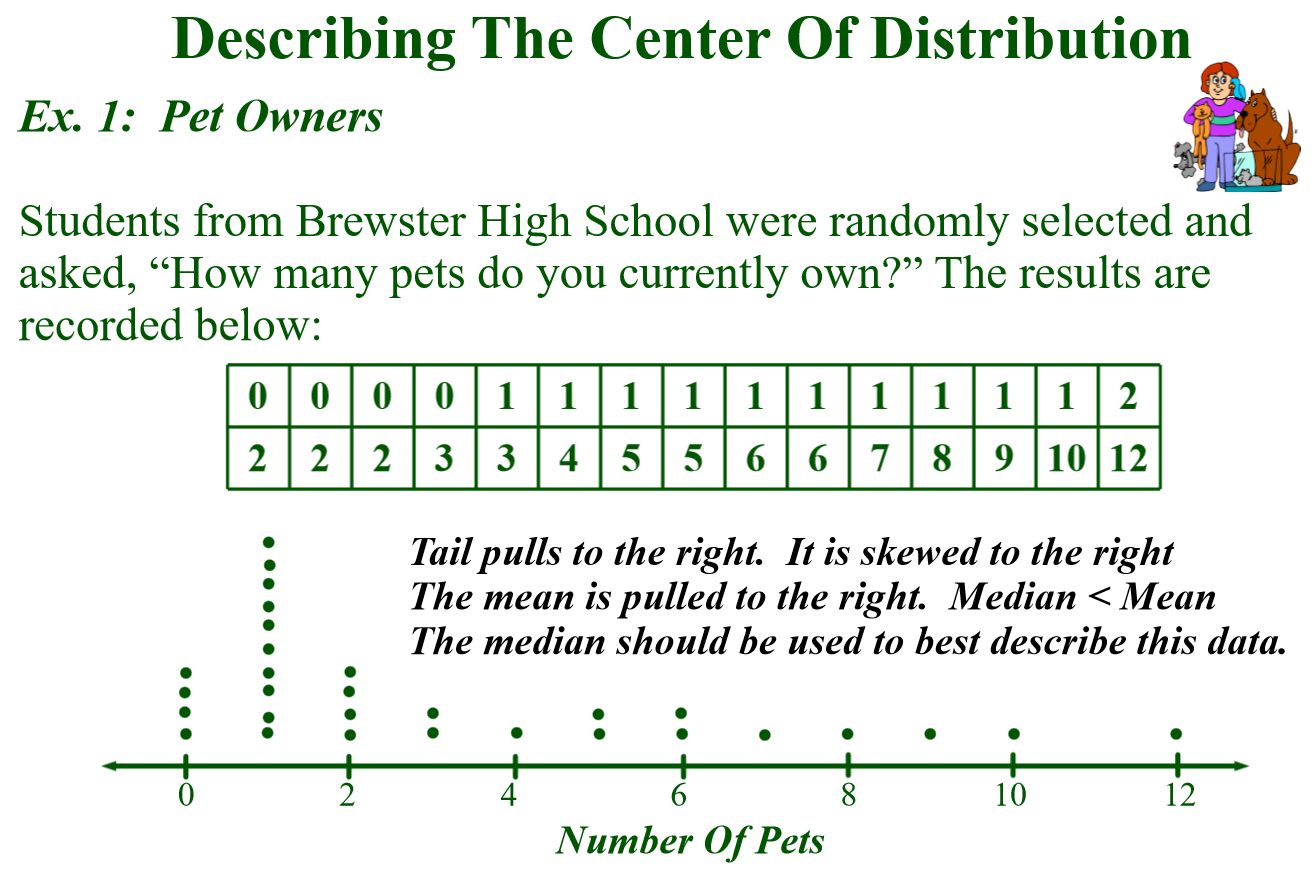
Here are the ages of people in a section of Chuck E. Cheese's. The data is presented in a dot plot. What is the mean of the data below?
Here are the ages of people in a section of Chuck E. Cheese's. The data is presented in a dot plot. What is the 3rd quartile of the data below?
Here are the ages of people in a section of Chuck E. Cheese's. The data is presented in a dot plot. What is the interquartile range of the data below?
Here are the ages of people in a section of Chuck E. Cheese's. The data is presented in a dot plot. What is the outlier of the data below?
Charlie’s Food Factory currently employs 28 workers whose ages are shown below on a dot plot. What is the range of the data below?
Charlie’s Food Factory currently employs 28 workers whose ages are shown below on a dot plot. How many workers are 18 years old?
Charlie’s Food Factory currently employs 28 workers whose ages are shown below on a dot plot. What is the median of the data below?
Charlie’s Food Factory currently employs 28 workers whose ages are shown below on a dot plot. Is the data skewed left, skewed right, or symmetrical?
This dot plot shows the number of miles ran by students this past Saturday. Which of the following is NOT true?
Four girls on a high school track-and-field team practiced the shot put. Each girl made 10 attempts, and the distances measured after each attempt are shown on the dot plots below. Which girl's attempts had the greatest range?
[Space is provided for optional work.]
Mr. Koestner and Mr. Mulvihill were discussing the Algebra Regents Exam results they were given to analyze. Those results are shown below in a dot plot.
Mr. Koestner said that the mean was 89.8 and the mode was 88.
Mr. Mulvihill said that the median was 88.5 and the interquartile range was 14.
Who was correct. Justify your answer in the space provided.
A survey was taken in Mrs. Othmer's Art Makerspace class about the number of siblings that each student has. Here are the results:
4, 1, 0, 1, 1, 2, 3, 10, 3, 4, 1, 0, 2, 0, 4, 3, 1, 3, 0
Create a dot plot on the number line provided.
Which is a better measure of central tendency for this data, the mean or the median? Explain your answer.