Lesson 2 - Line of Best Fit
star
star
star
star
star
Posljednje ažuriranje about 6 years ago
20
1
CC.2.2.8.C.2
1
1
CC.2.2.8.C.2
1
1
1
1
CC.2.2.8.C.2
1
CC.2.2.8.C.2
2
CC.2.2.8.C.2
1
1
CC.2.2.8.C.2
1
CC.2.2.8.C.2
1
1
1
1
1
1
1
1
Describe the association of this graph

Draw a line of best fit to fit the data
Draw a LINE OF BEST FIT on the scatterplot below.
Write an APPROXIMATE equation in slope intercept form (y=mx+b) of the line you drew in the scatterplot above.
Circle one piece of date that you believe to be the outlier in the scatterplot below.
Describe how you know the point you chose above is an outlier.
Draw a scatterplot below that has no association. Be sure label your x and y axis with appropriate labels.
The scatter plot below shows how many points Denise scored in a game based on the number of hours she practiced. Draw a line of best fit. Remember that the line does not need to intersect each of the points and that the line does not need to pass through the origin to model the data.
Write an equation for your line of best fit in the form y=mx+b
Using your line of best fit, determine how many points should Denise expect to score after she practices for 3 hours
What does the slope mean in this situation? Express your answer as a unit rate
What does the y-intercept mean in the context of this situation?
Draw a line of best fit that you think best represents the data.
Using your line of best fit, what would you expect the cost of 3000 square foot house to be?
Use two points that you crossed through with your line of best fit to create an equation in the form of y=mx+b
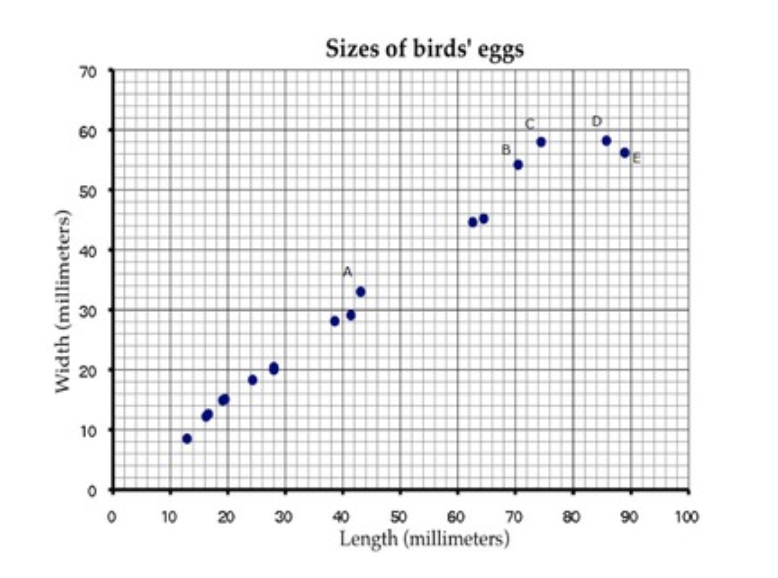
What does the graph above say about the size of birds' eggs?
What would you predict the length of bird with a width of 40mm to be?
Draw a line of best fit for the Size of the birds eggs.
Sancho and Shae have both drawn a line of best fit for the data at the top. Who do you think drew the most accurate line of best fit and why?

Analyse the graph below.
Which statement(s) is correct:
