Math Spiral 1: Statistics & Probability
star
star
star
star
star
Last updated almost 6 years ago
4 Nsɛmmisa
5
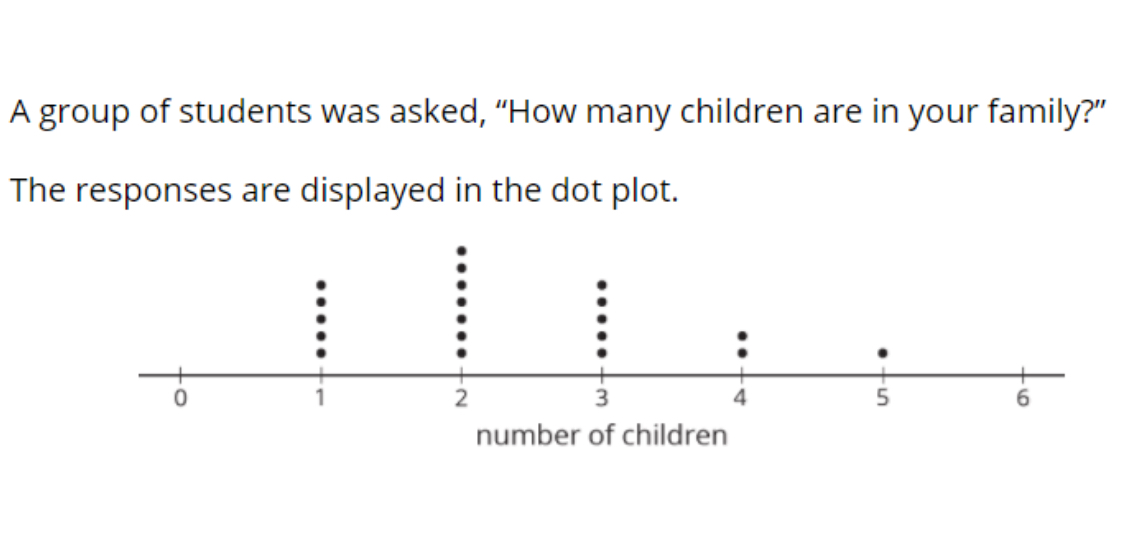
How many students were surveyed?
How many students were surveyed?
5
5
10
Directions: Show your work as to how you figured out the answer. Do internet research on how to find percentages if you need help.
What PERCENTAGE of the surveyed students are an only child?
Directions: Show your work as to how you figured out the answer. Do internet research on how to find percentages if you need help.
What PERCENTAGE of the surveyed students are an only child?