Math Spiral 3: Statistics & Probability
star
star
star
star
star
Last updated almost 6 years ago
5 Nsɛmmisa
5
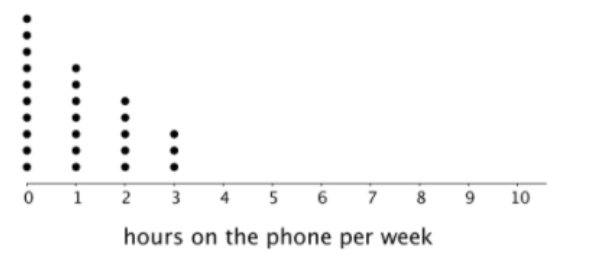
How many of the students reported not talking on the phone during the week?
How many of the students reported not talking on the phone during the week?
5
5
5
5
Hint: Research types of data distribution.
What statement can you make about how the data is distributed on this dot plot?
Hint: Research types of data distribution.
What statement can you make about how the data is distributed on this dot plot?