Math Spiral Quiz (1-3): Statistics & Probability
star
star
star
star
star
Last updated over 5 years ago
4 questions
5
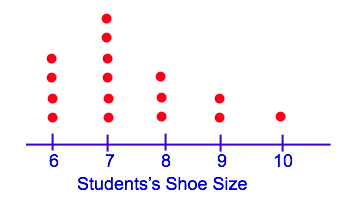
How many students were surveyed?
5
Which shoe size had the most responses and which had the least?
5
Directions: Make sure to show your work as to how you caluclated the percentage.
What percentage of students have a size 6 shoe?
Directions: Make sure to show your work as to how you caluclated the percentage.
What percentage of students have a size 6 shoe?
5
Explain what type of data distribution is shown in the dot plot and specifically why it is that type of distribution.
