Lesson 1: Identifying and Representing Patterns
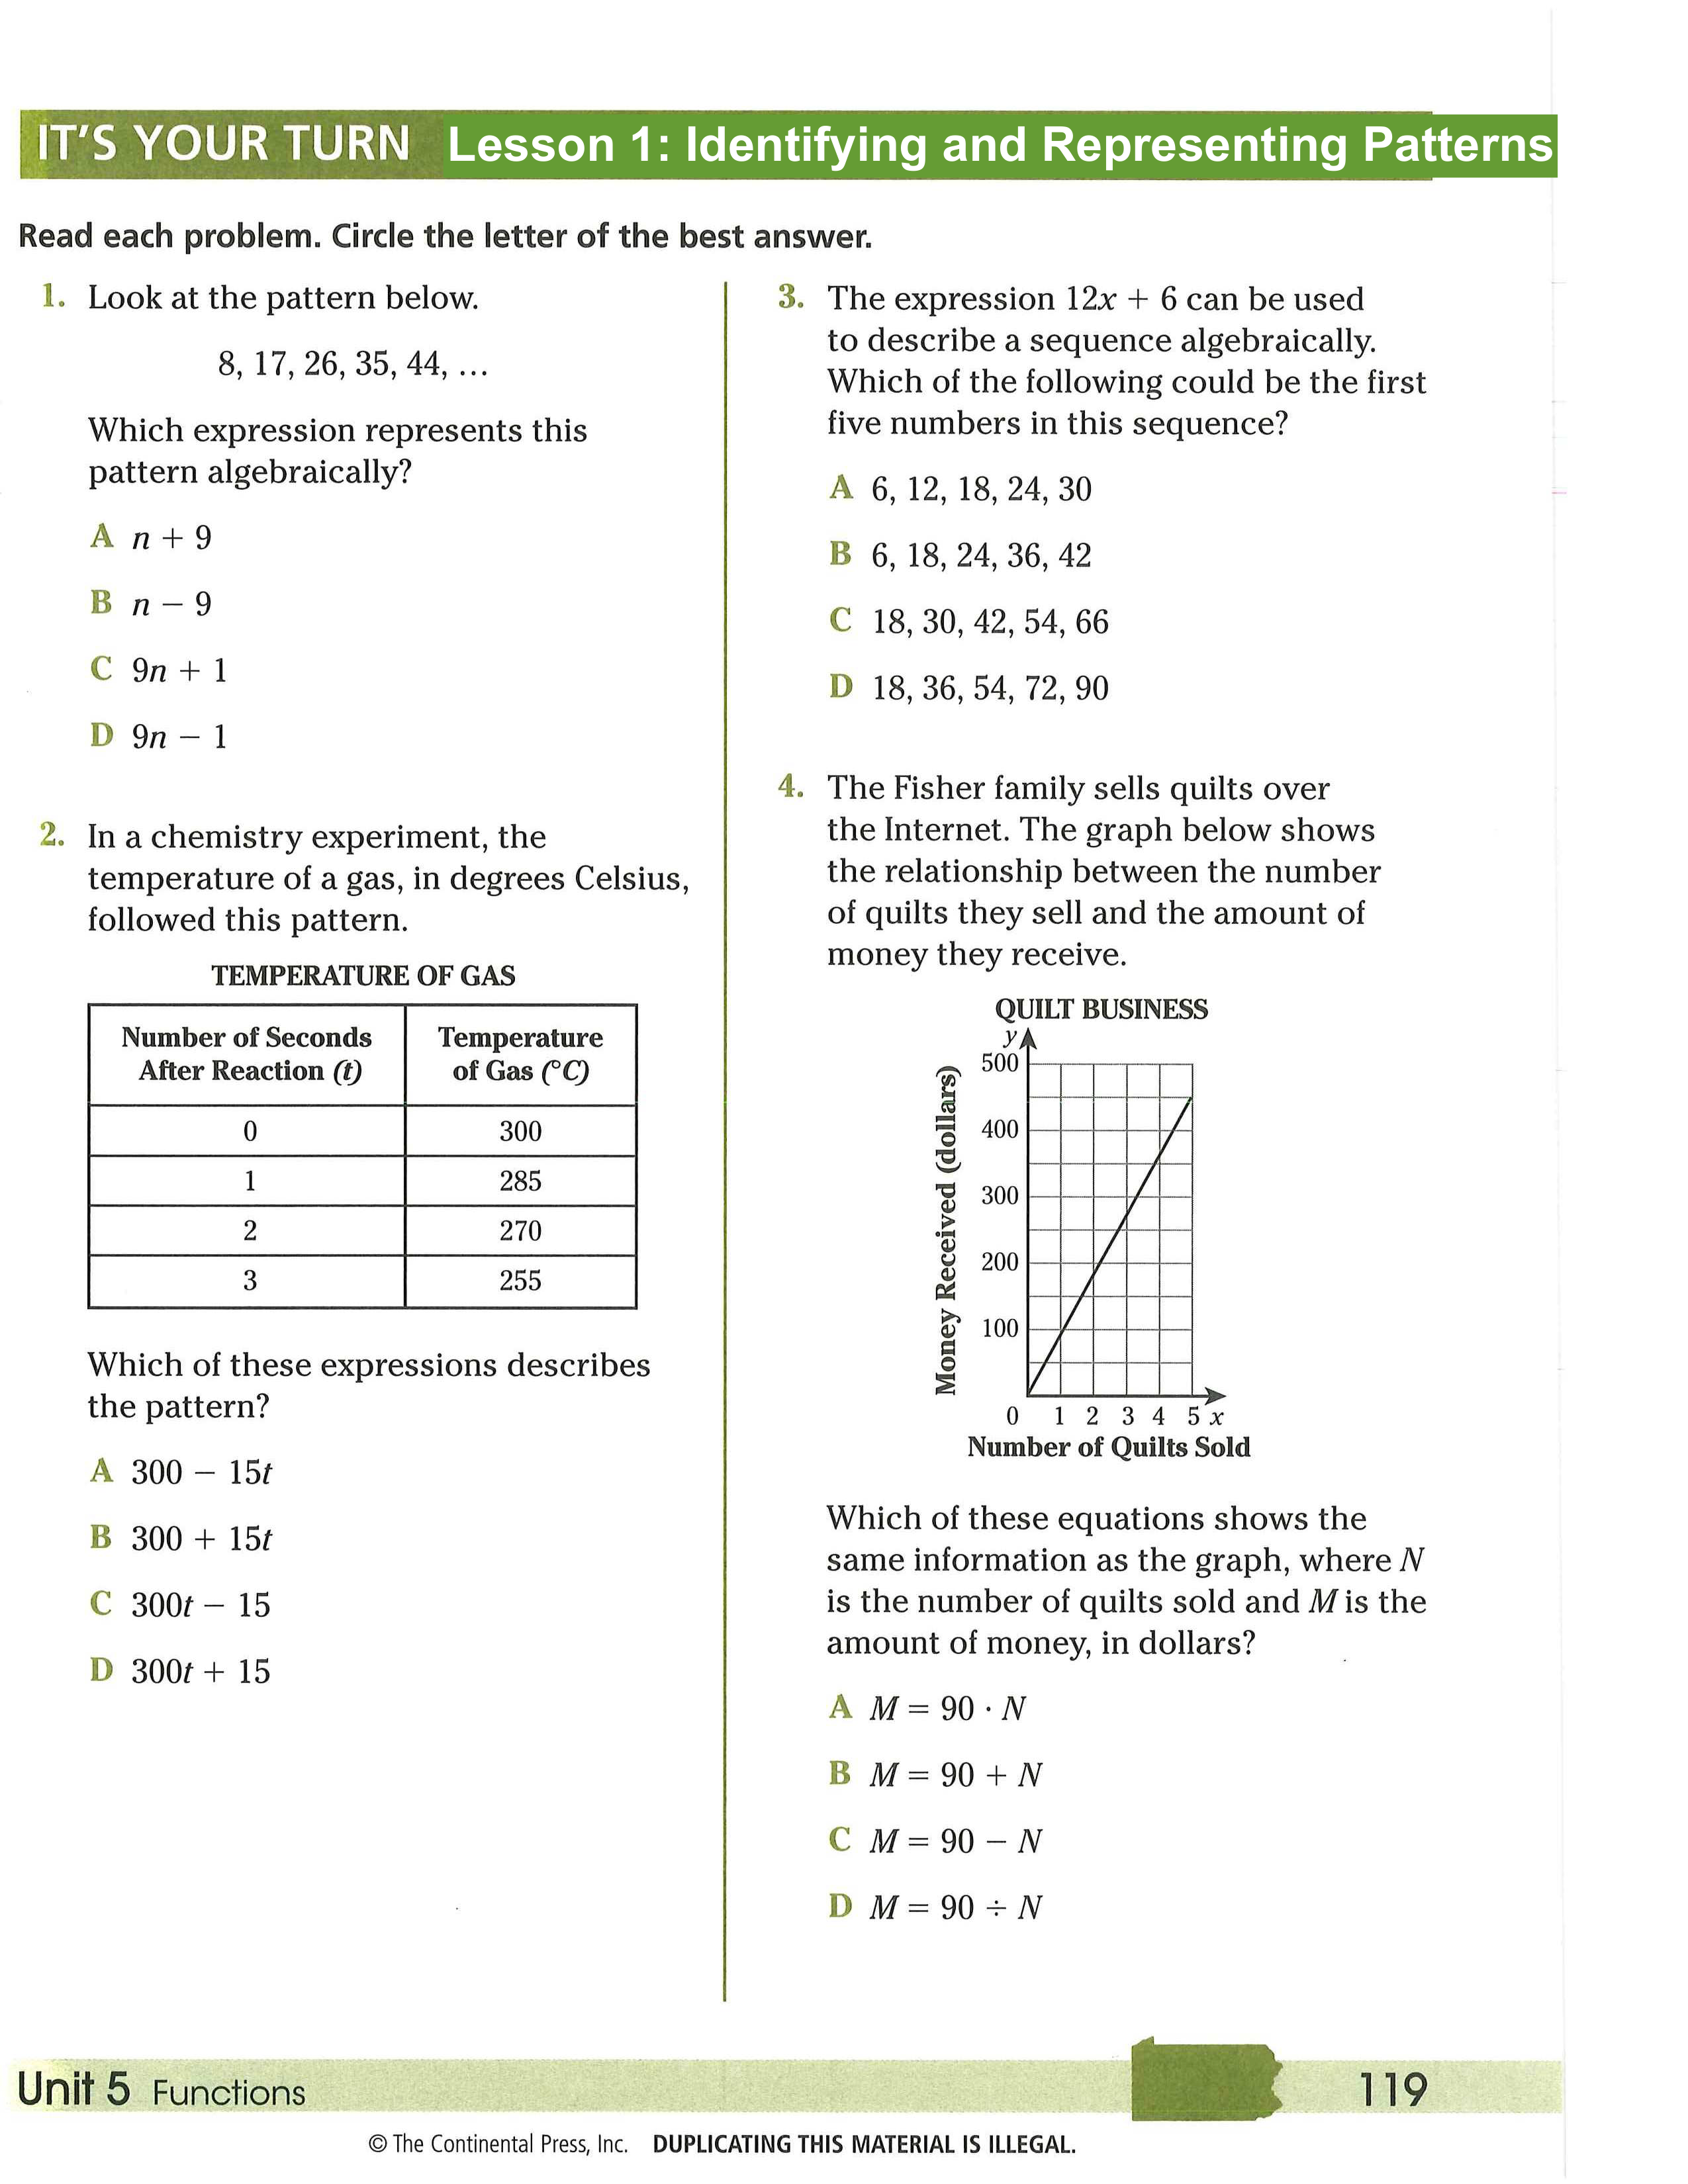
1.
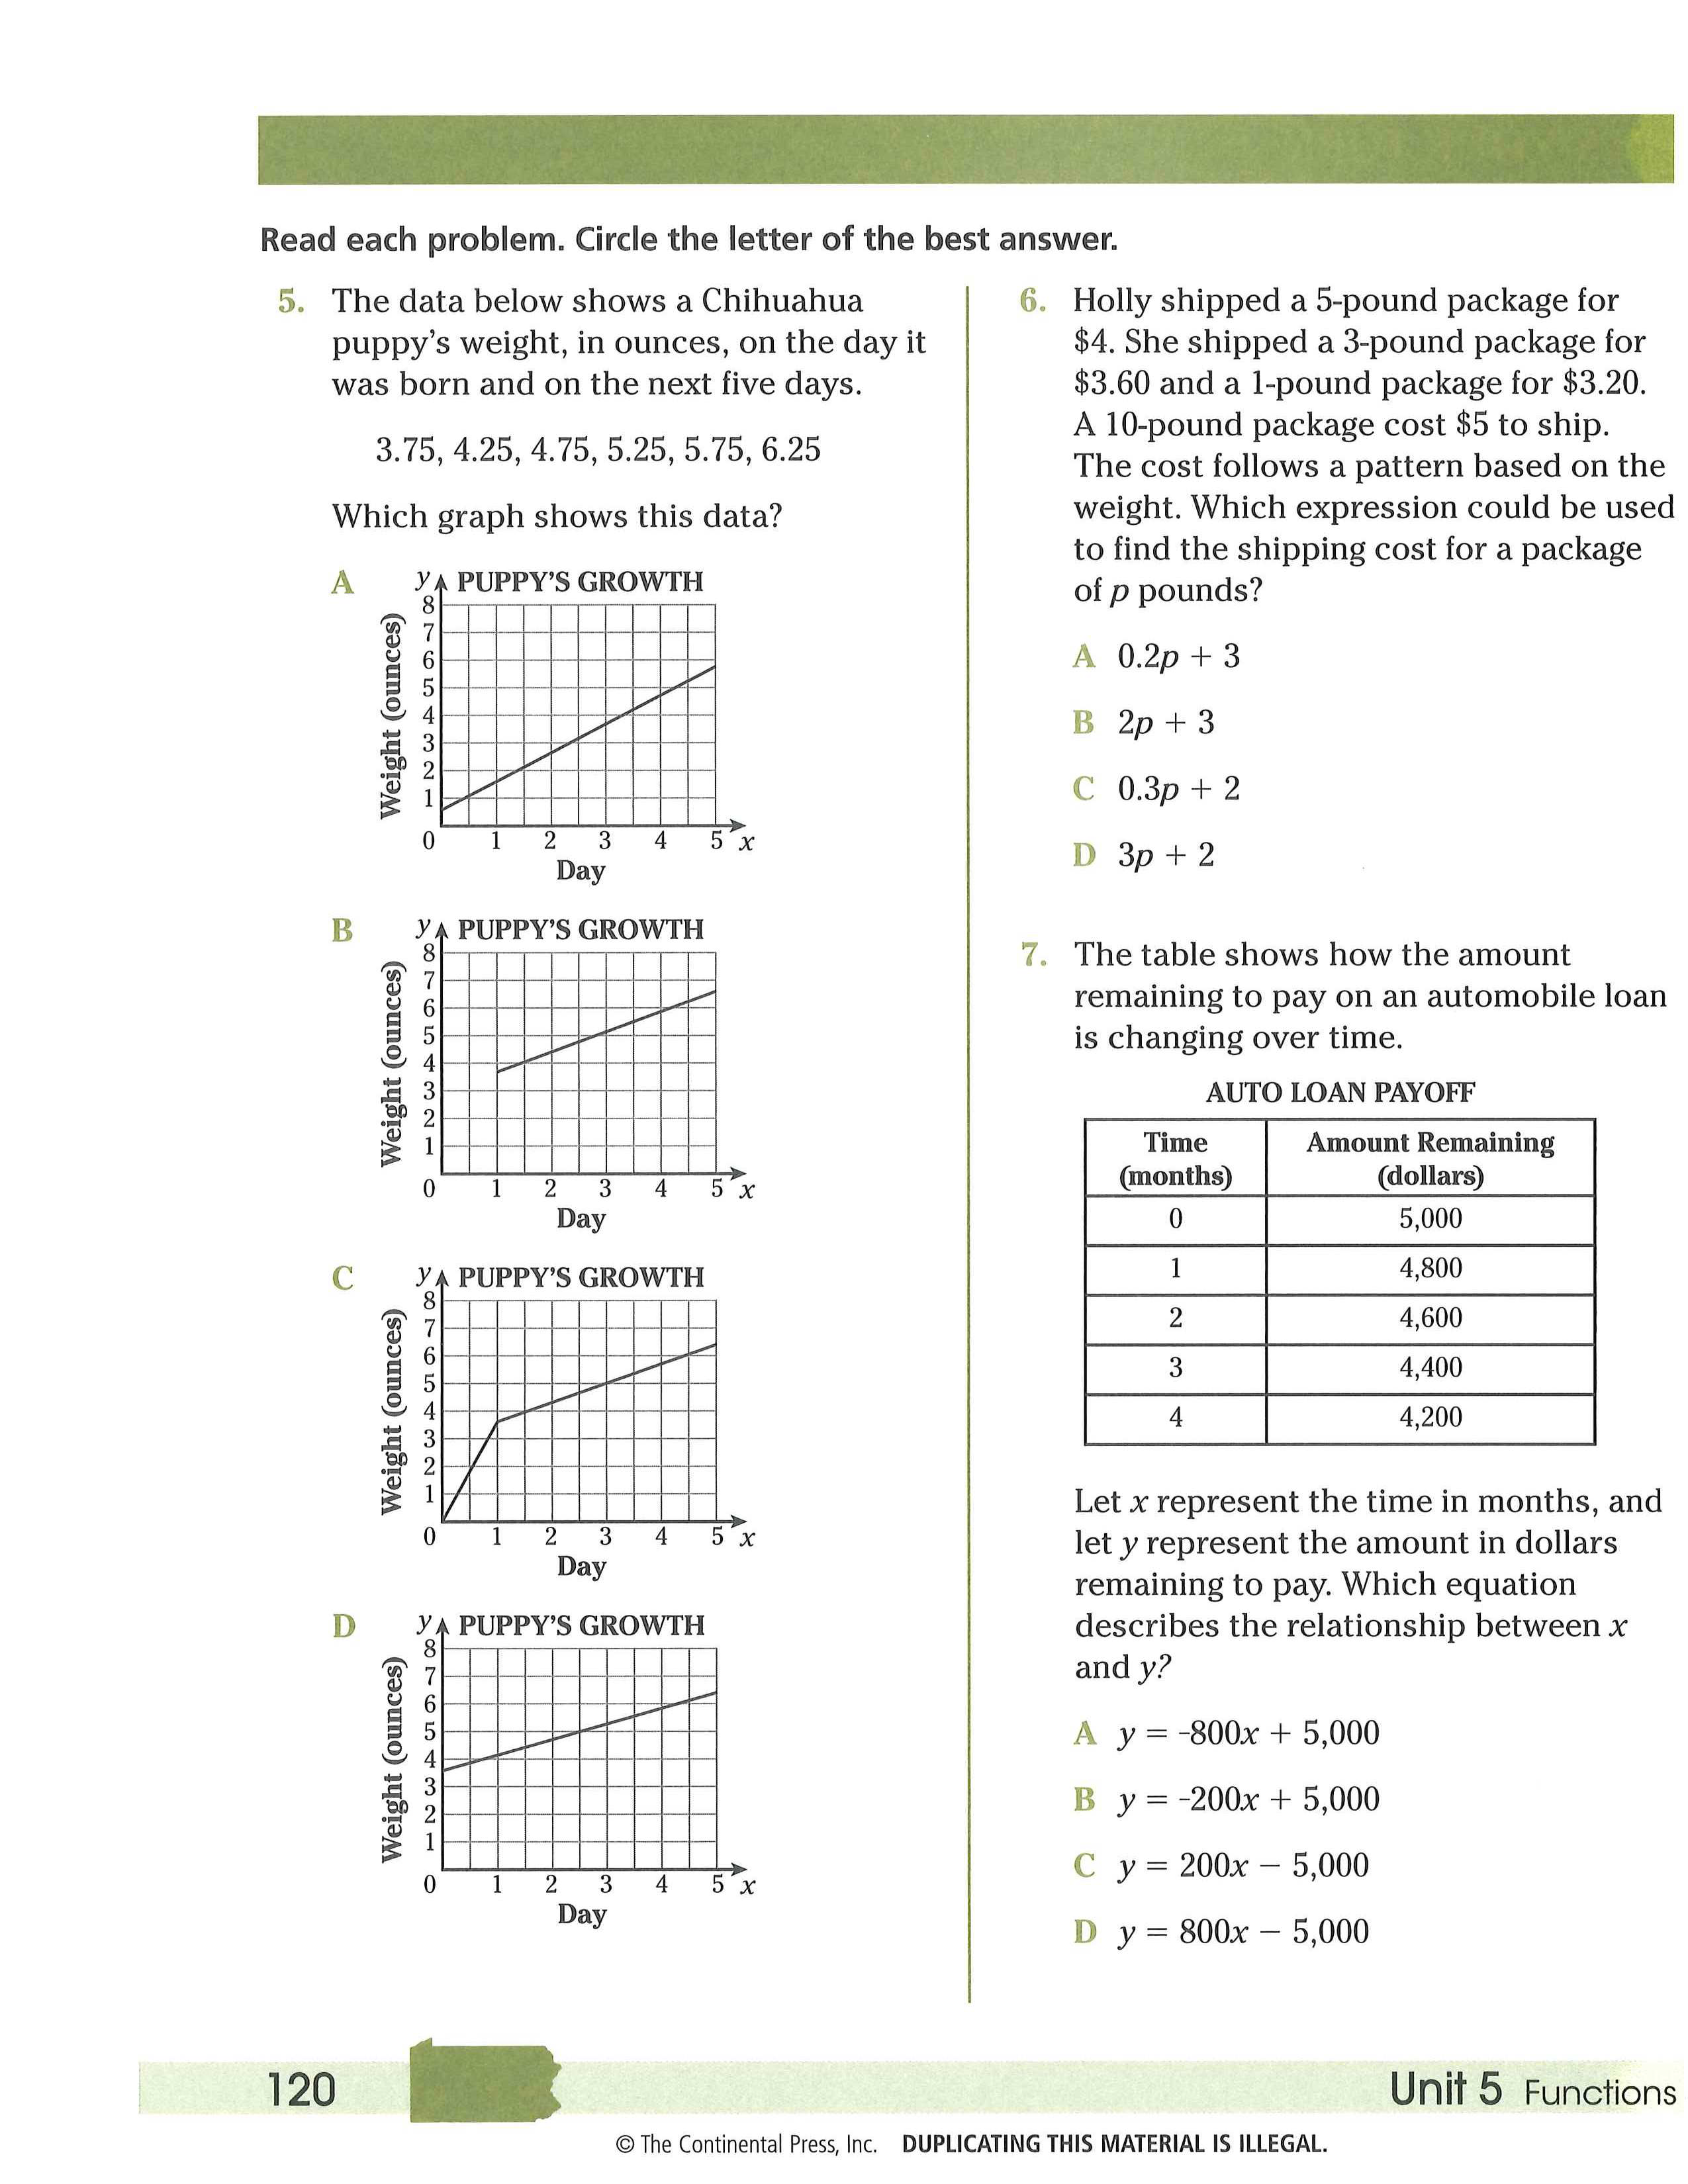
5.
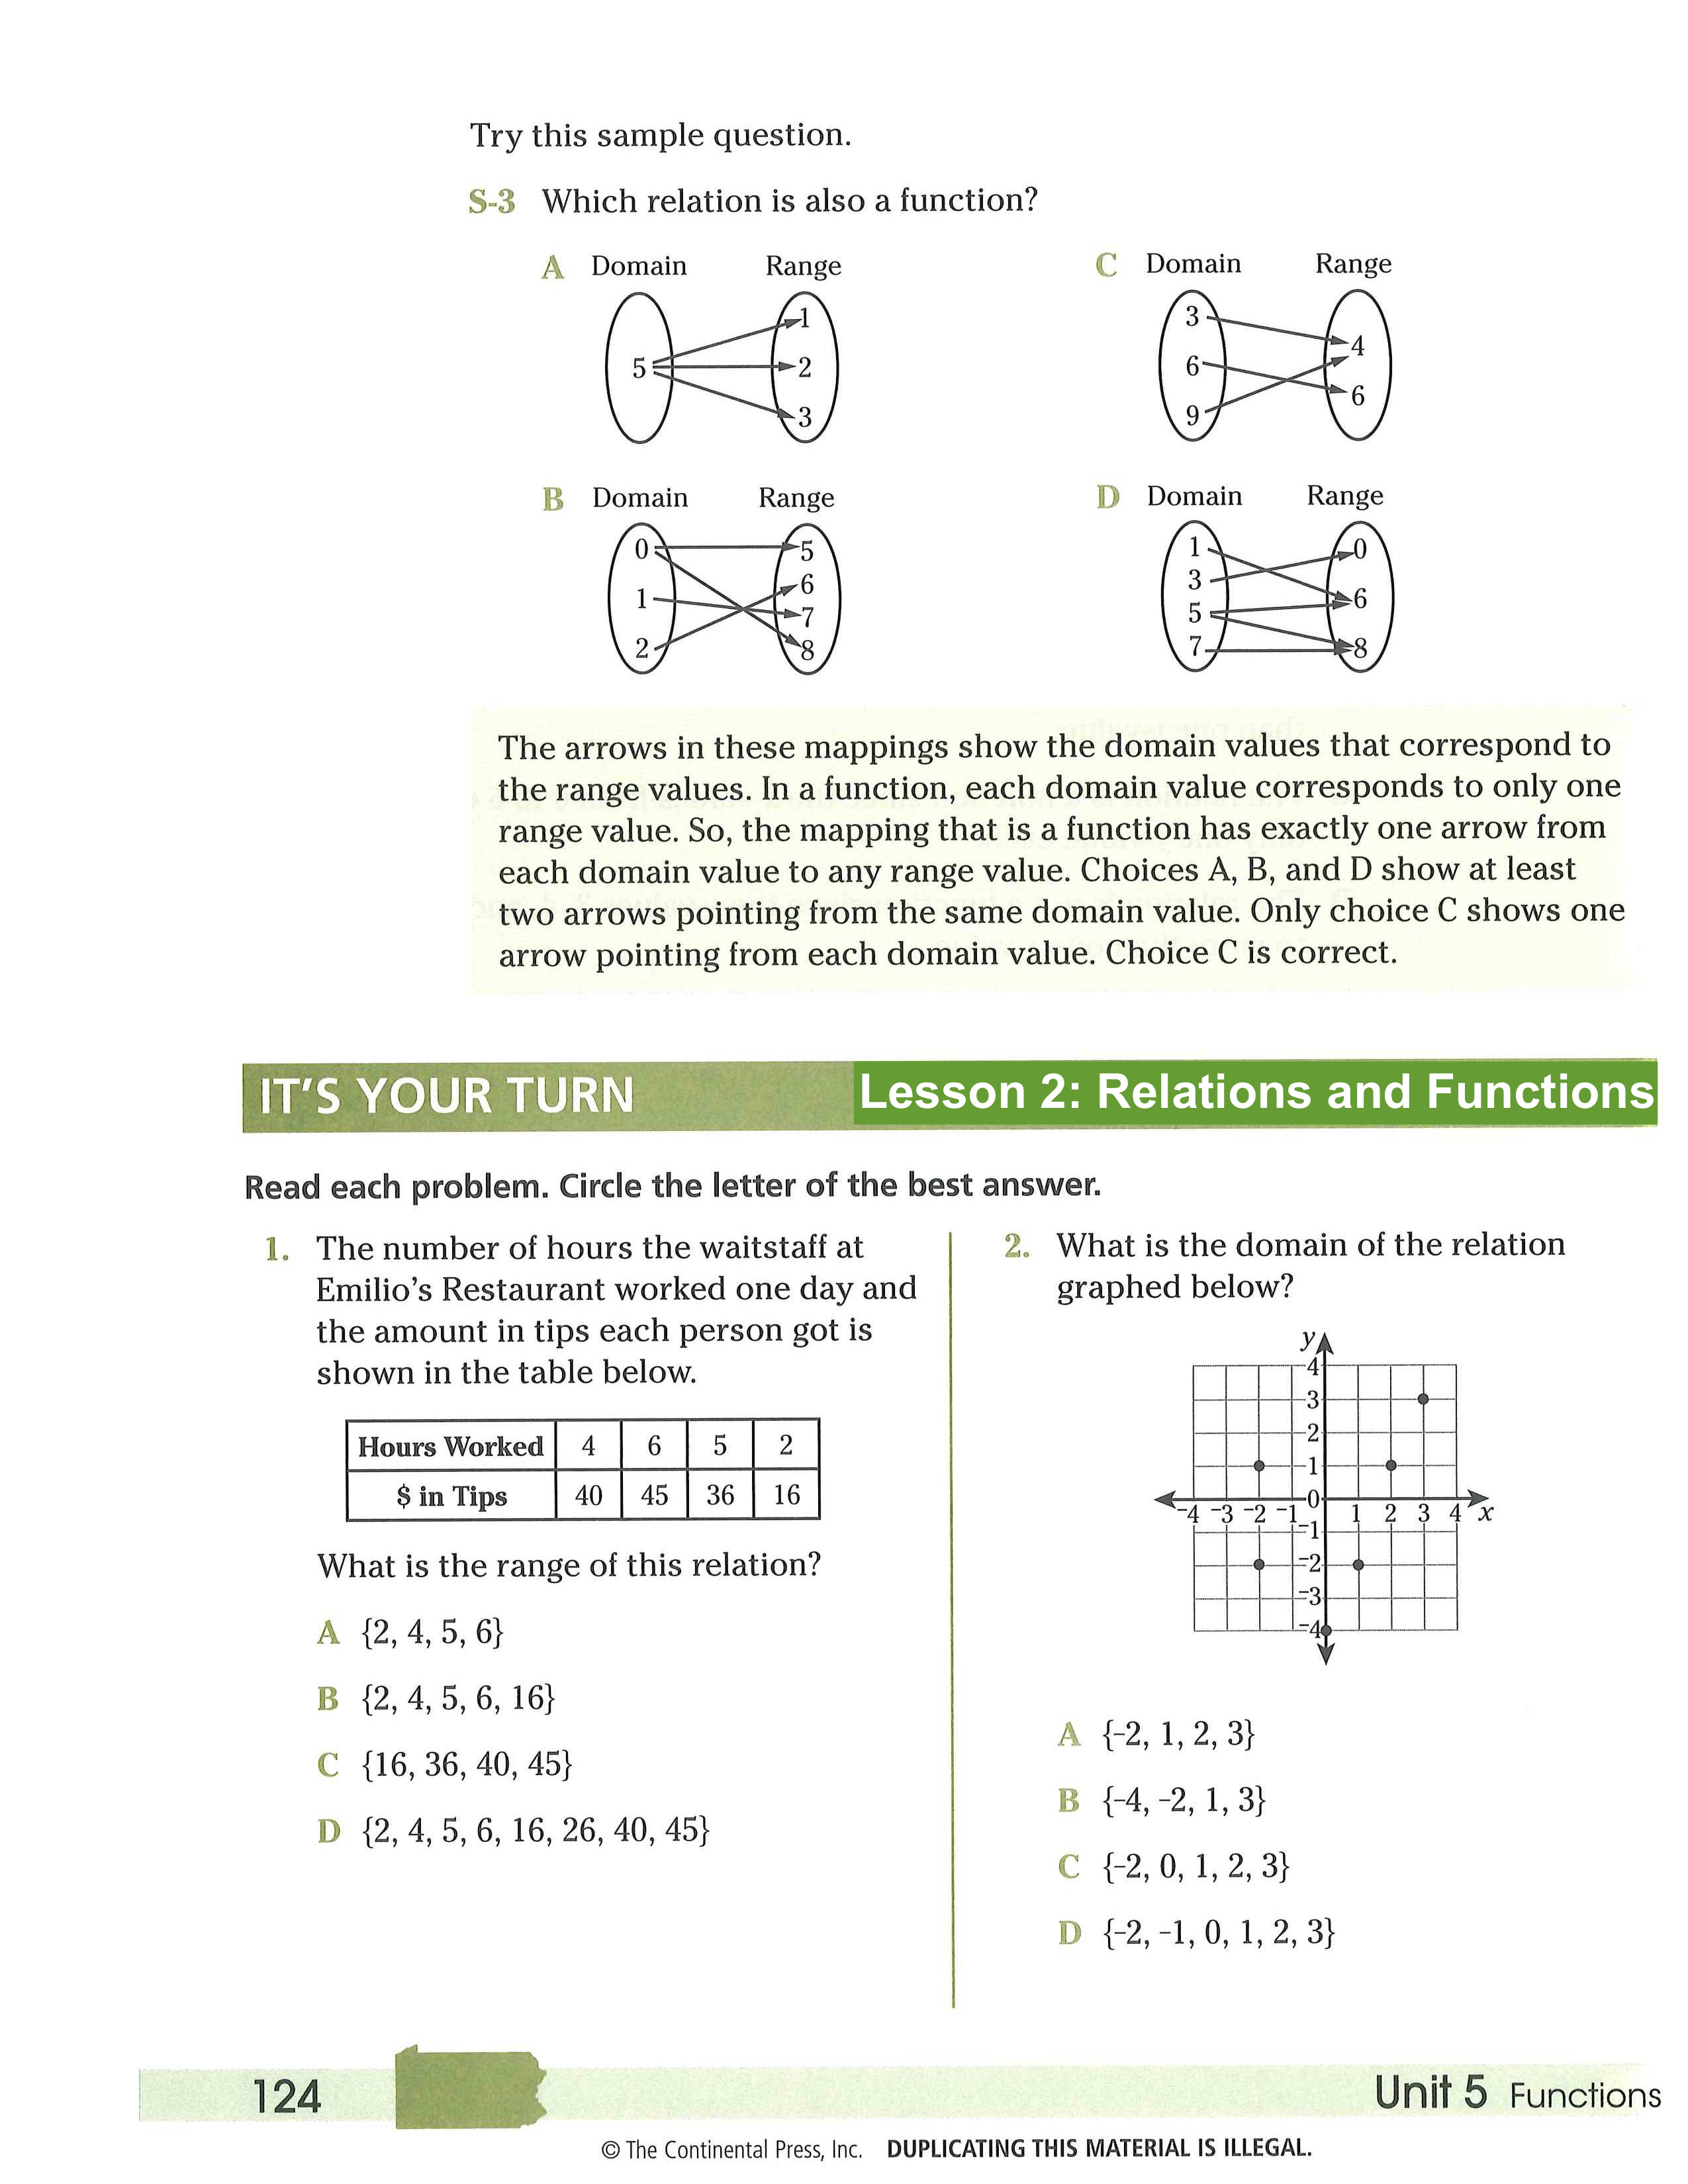
Lesson 2: Relations and Functions
1.

3.

6.
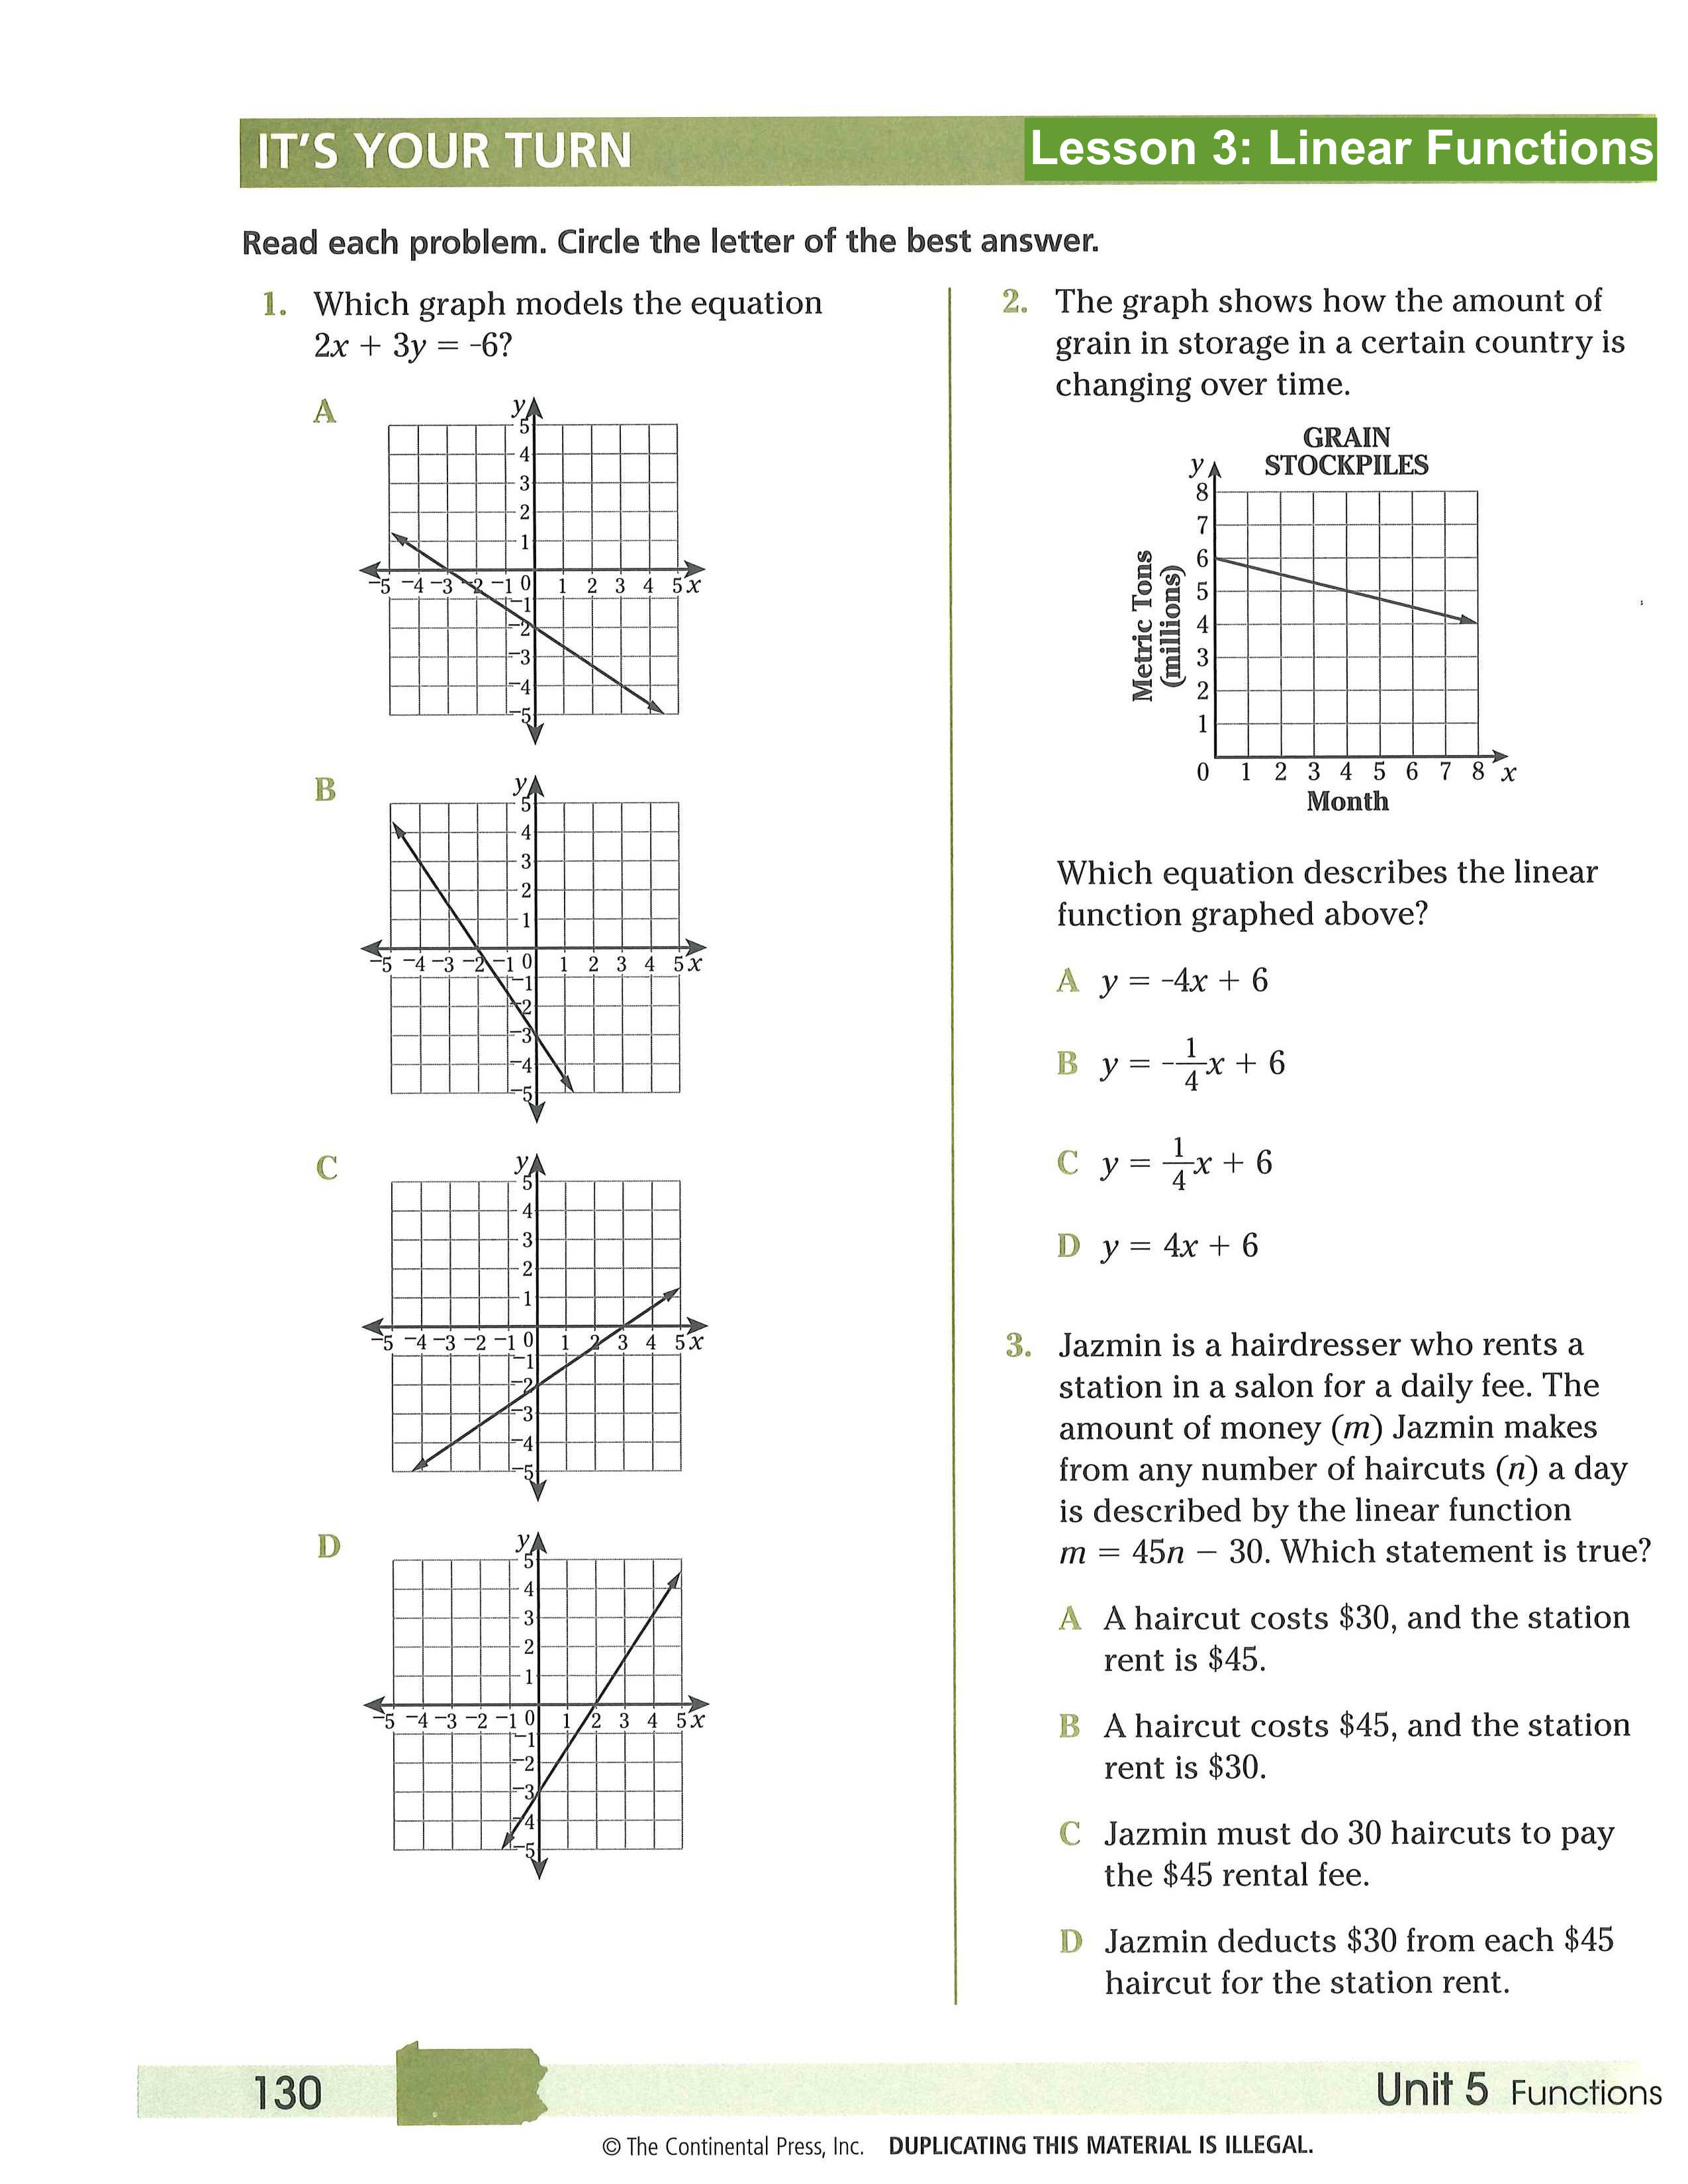
Lesson 3: Linear Functins
1.

4.
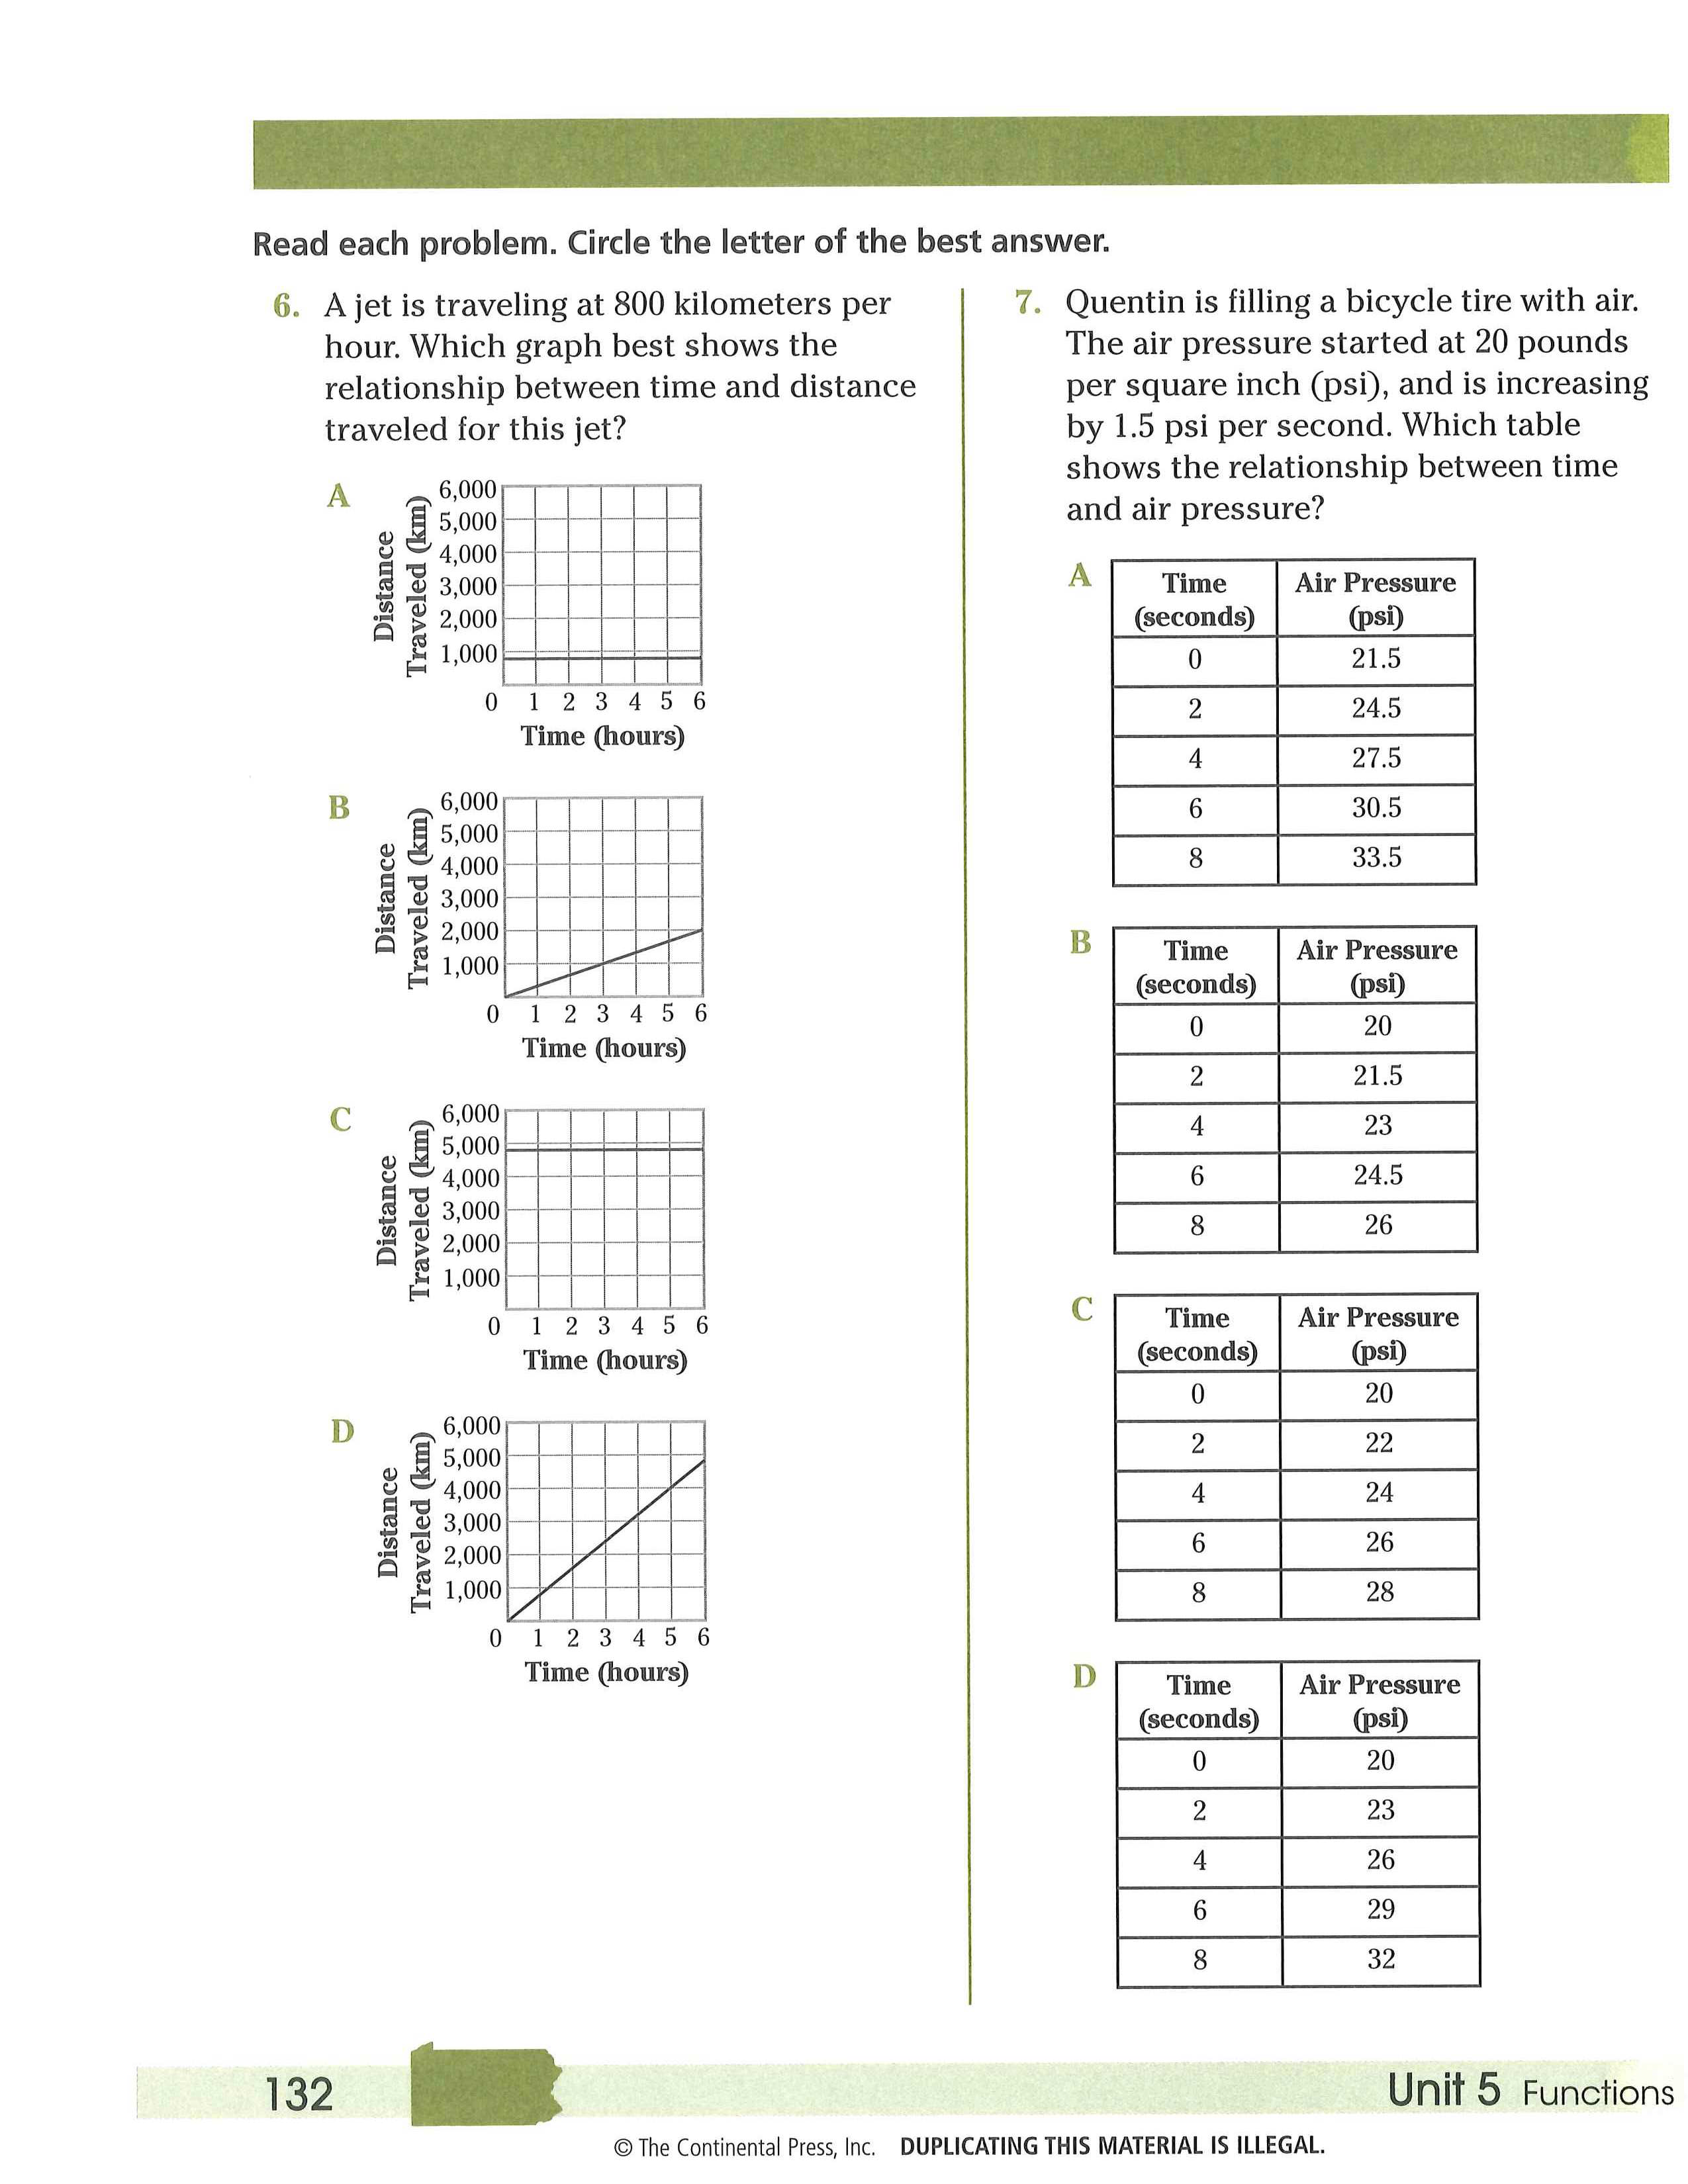
6.
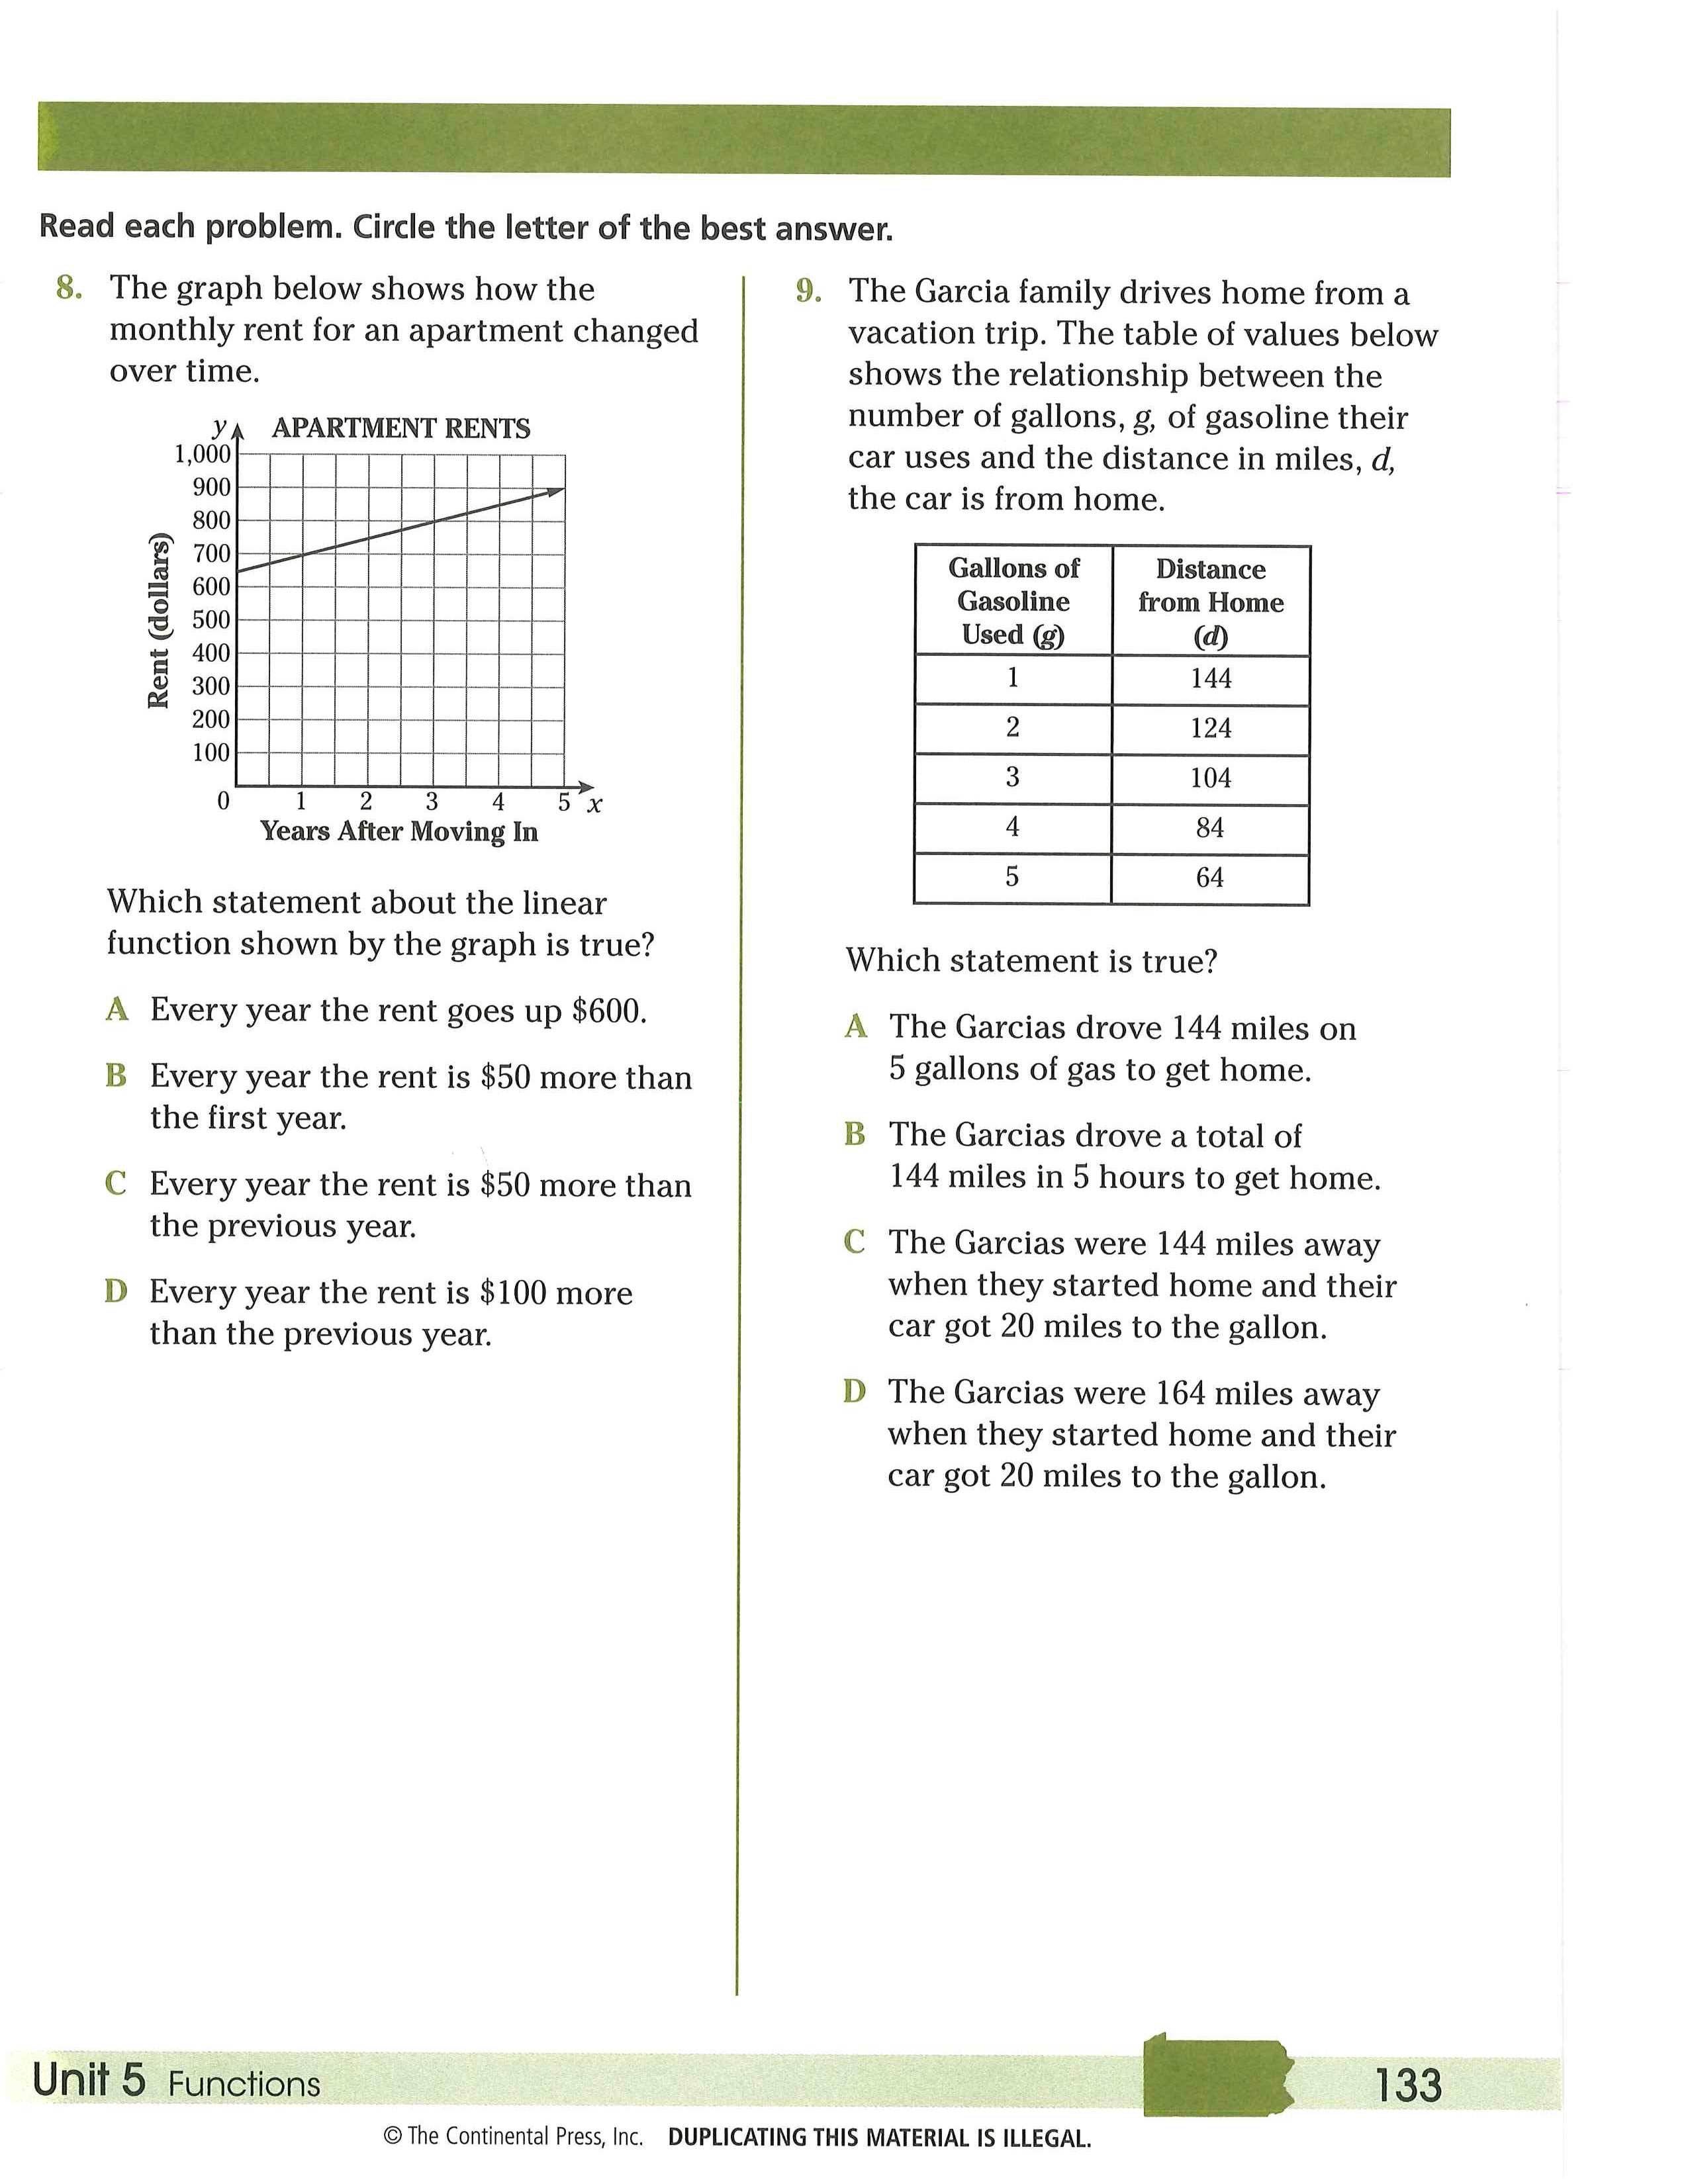
8.
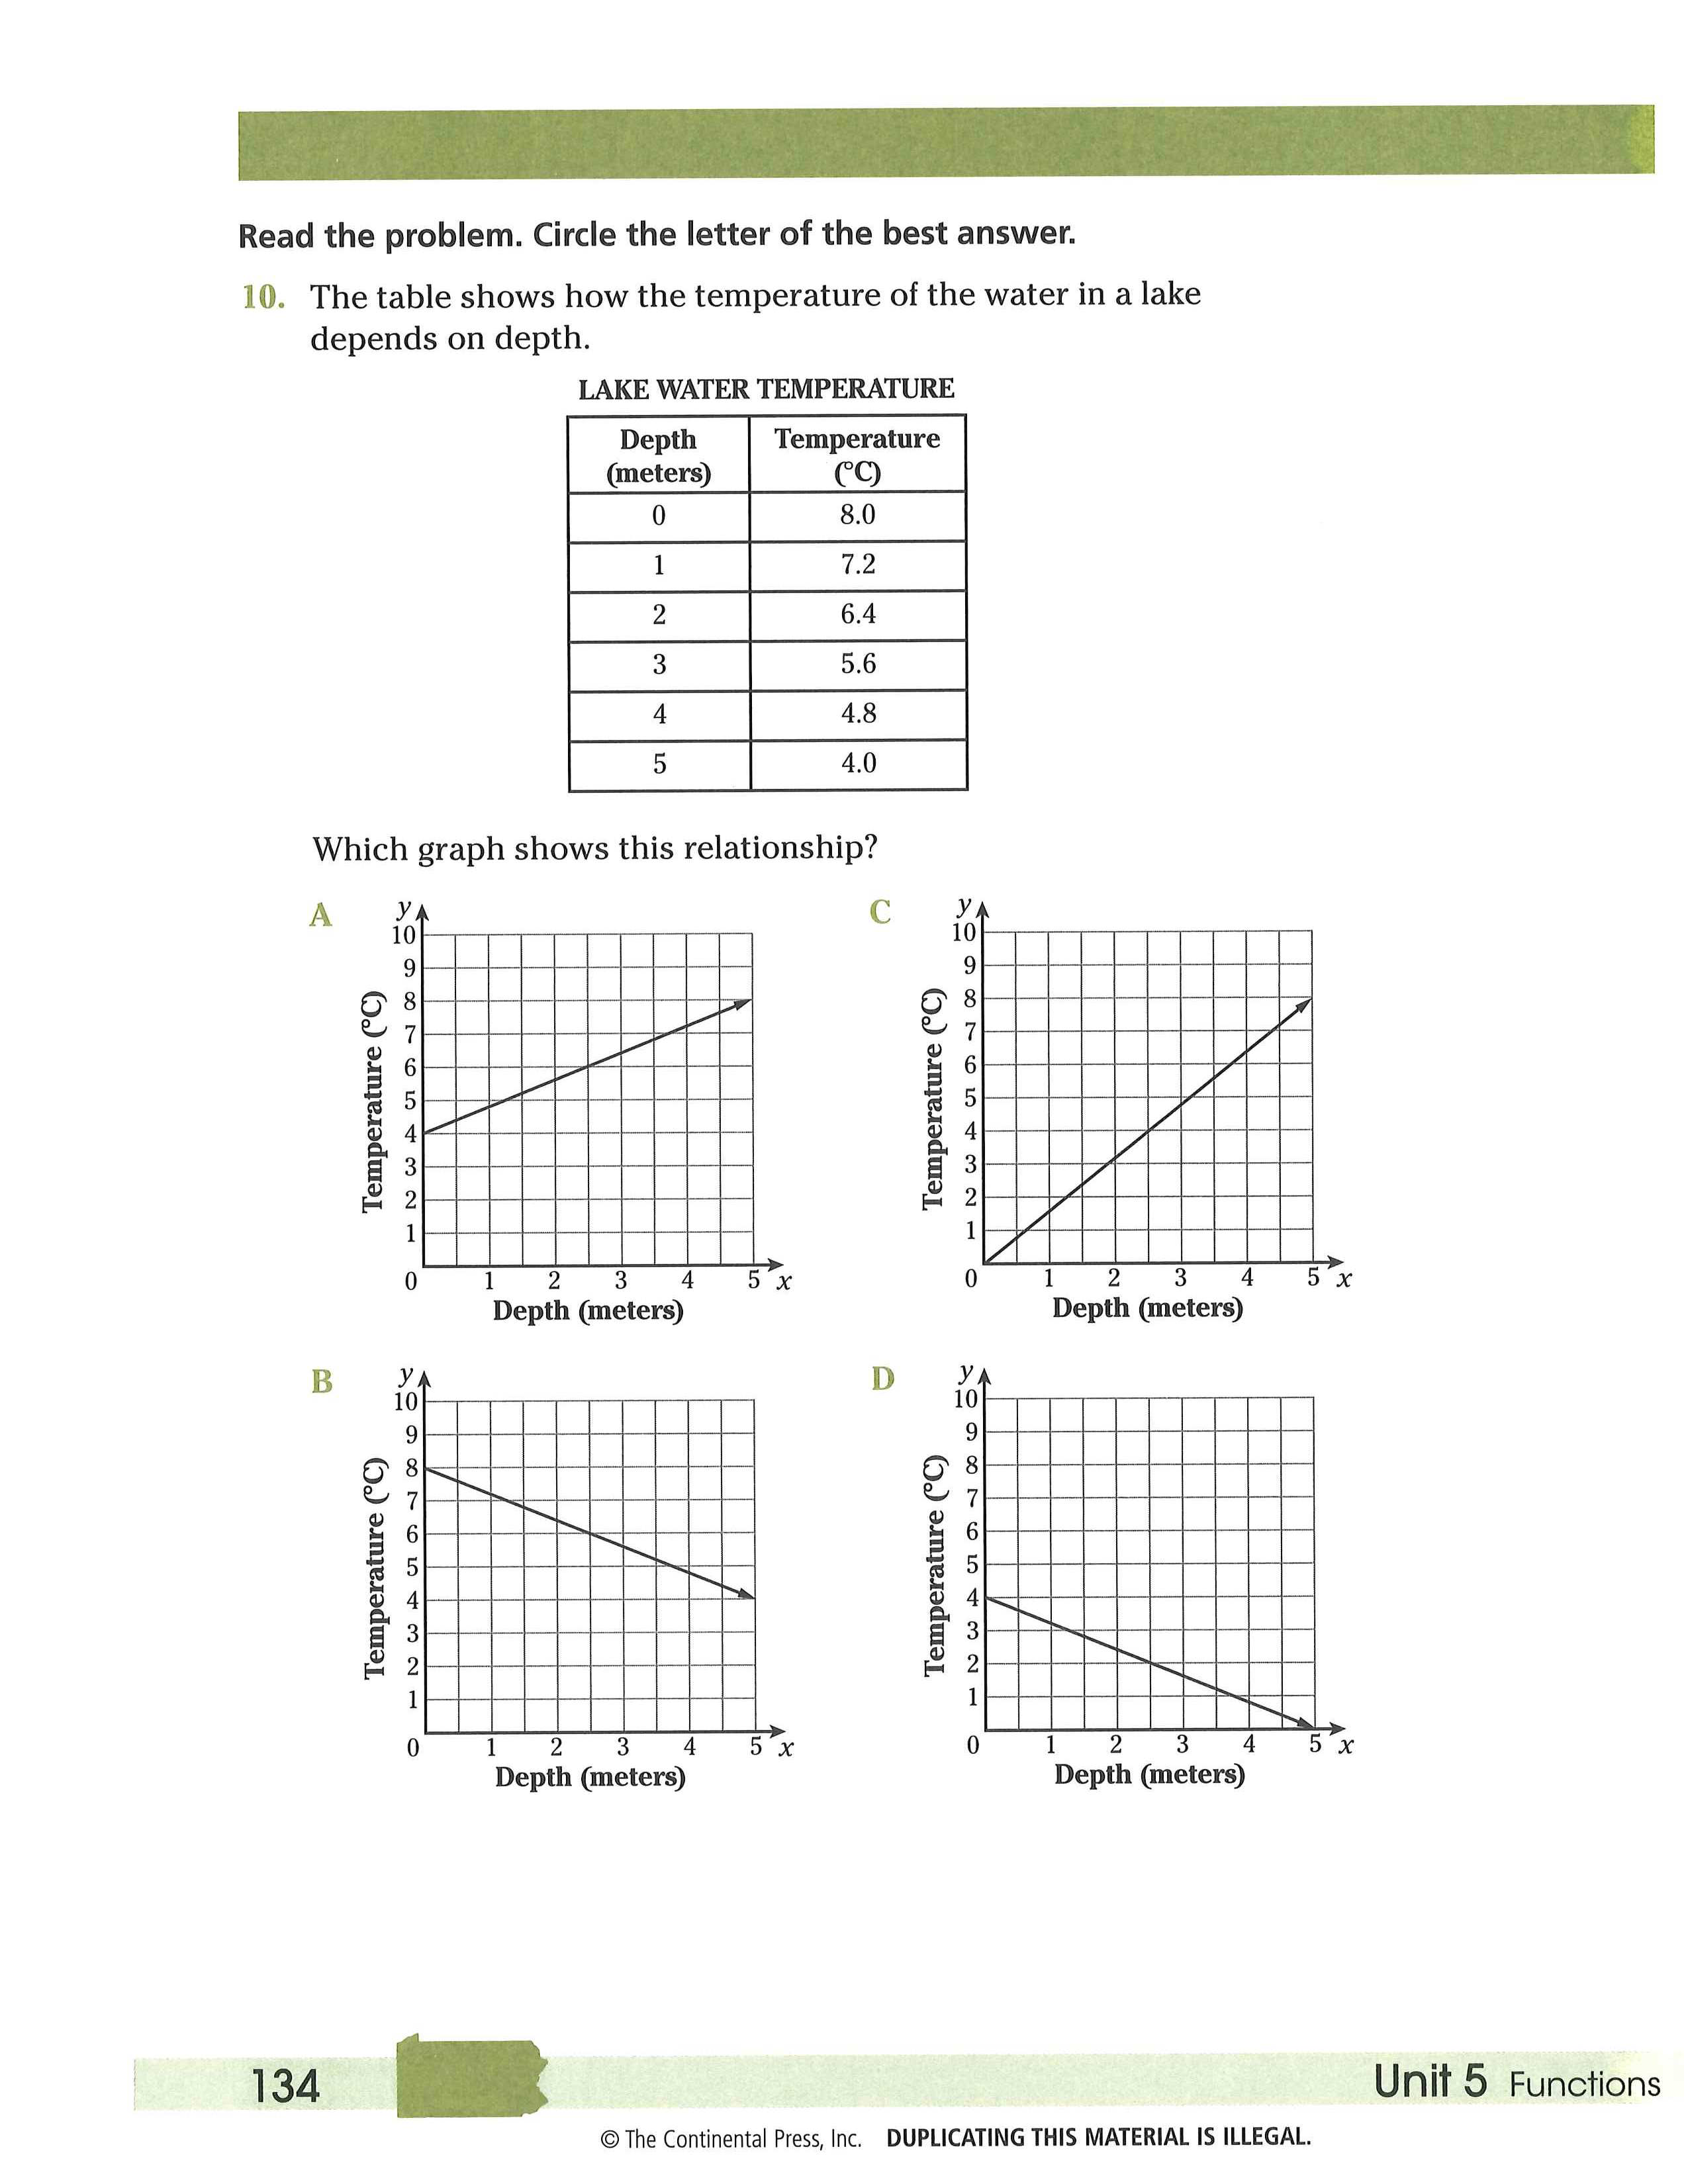
10.

1a. Graph the points fromthe table. Label each axis.
1b. Identify the domain and range of the data. Name the values and what they represent.
1c. Explain how you know whether or not this relation is a function.

2a. Write an equation to show the relationship between n, the nubmer of T-shirts printed, and C, the total cost in dollars.
2b. Graph your equation on this coordinate plane. Be sure to include an appropriate scale on each axis.

2c. What would be the total cost of an order of 120 T-shirts?
2d. Explain how you found your answer to part C.

3a. Does this grpah describe a function? Explain why or why not.
3b. Write an equation to describe the relationship shown in the graph.
3c. Explain the meaning of the variables in your equation.
3d. According to your equation, if a building is 160 meters tall, what would be the length of its shadow?
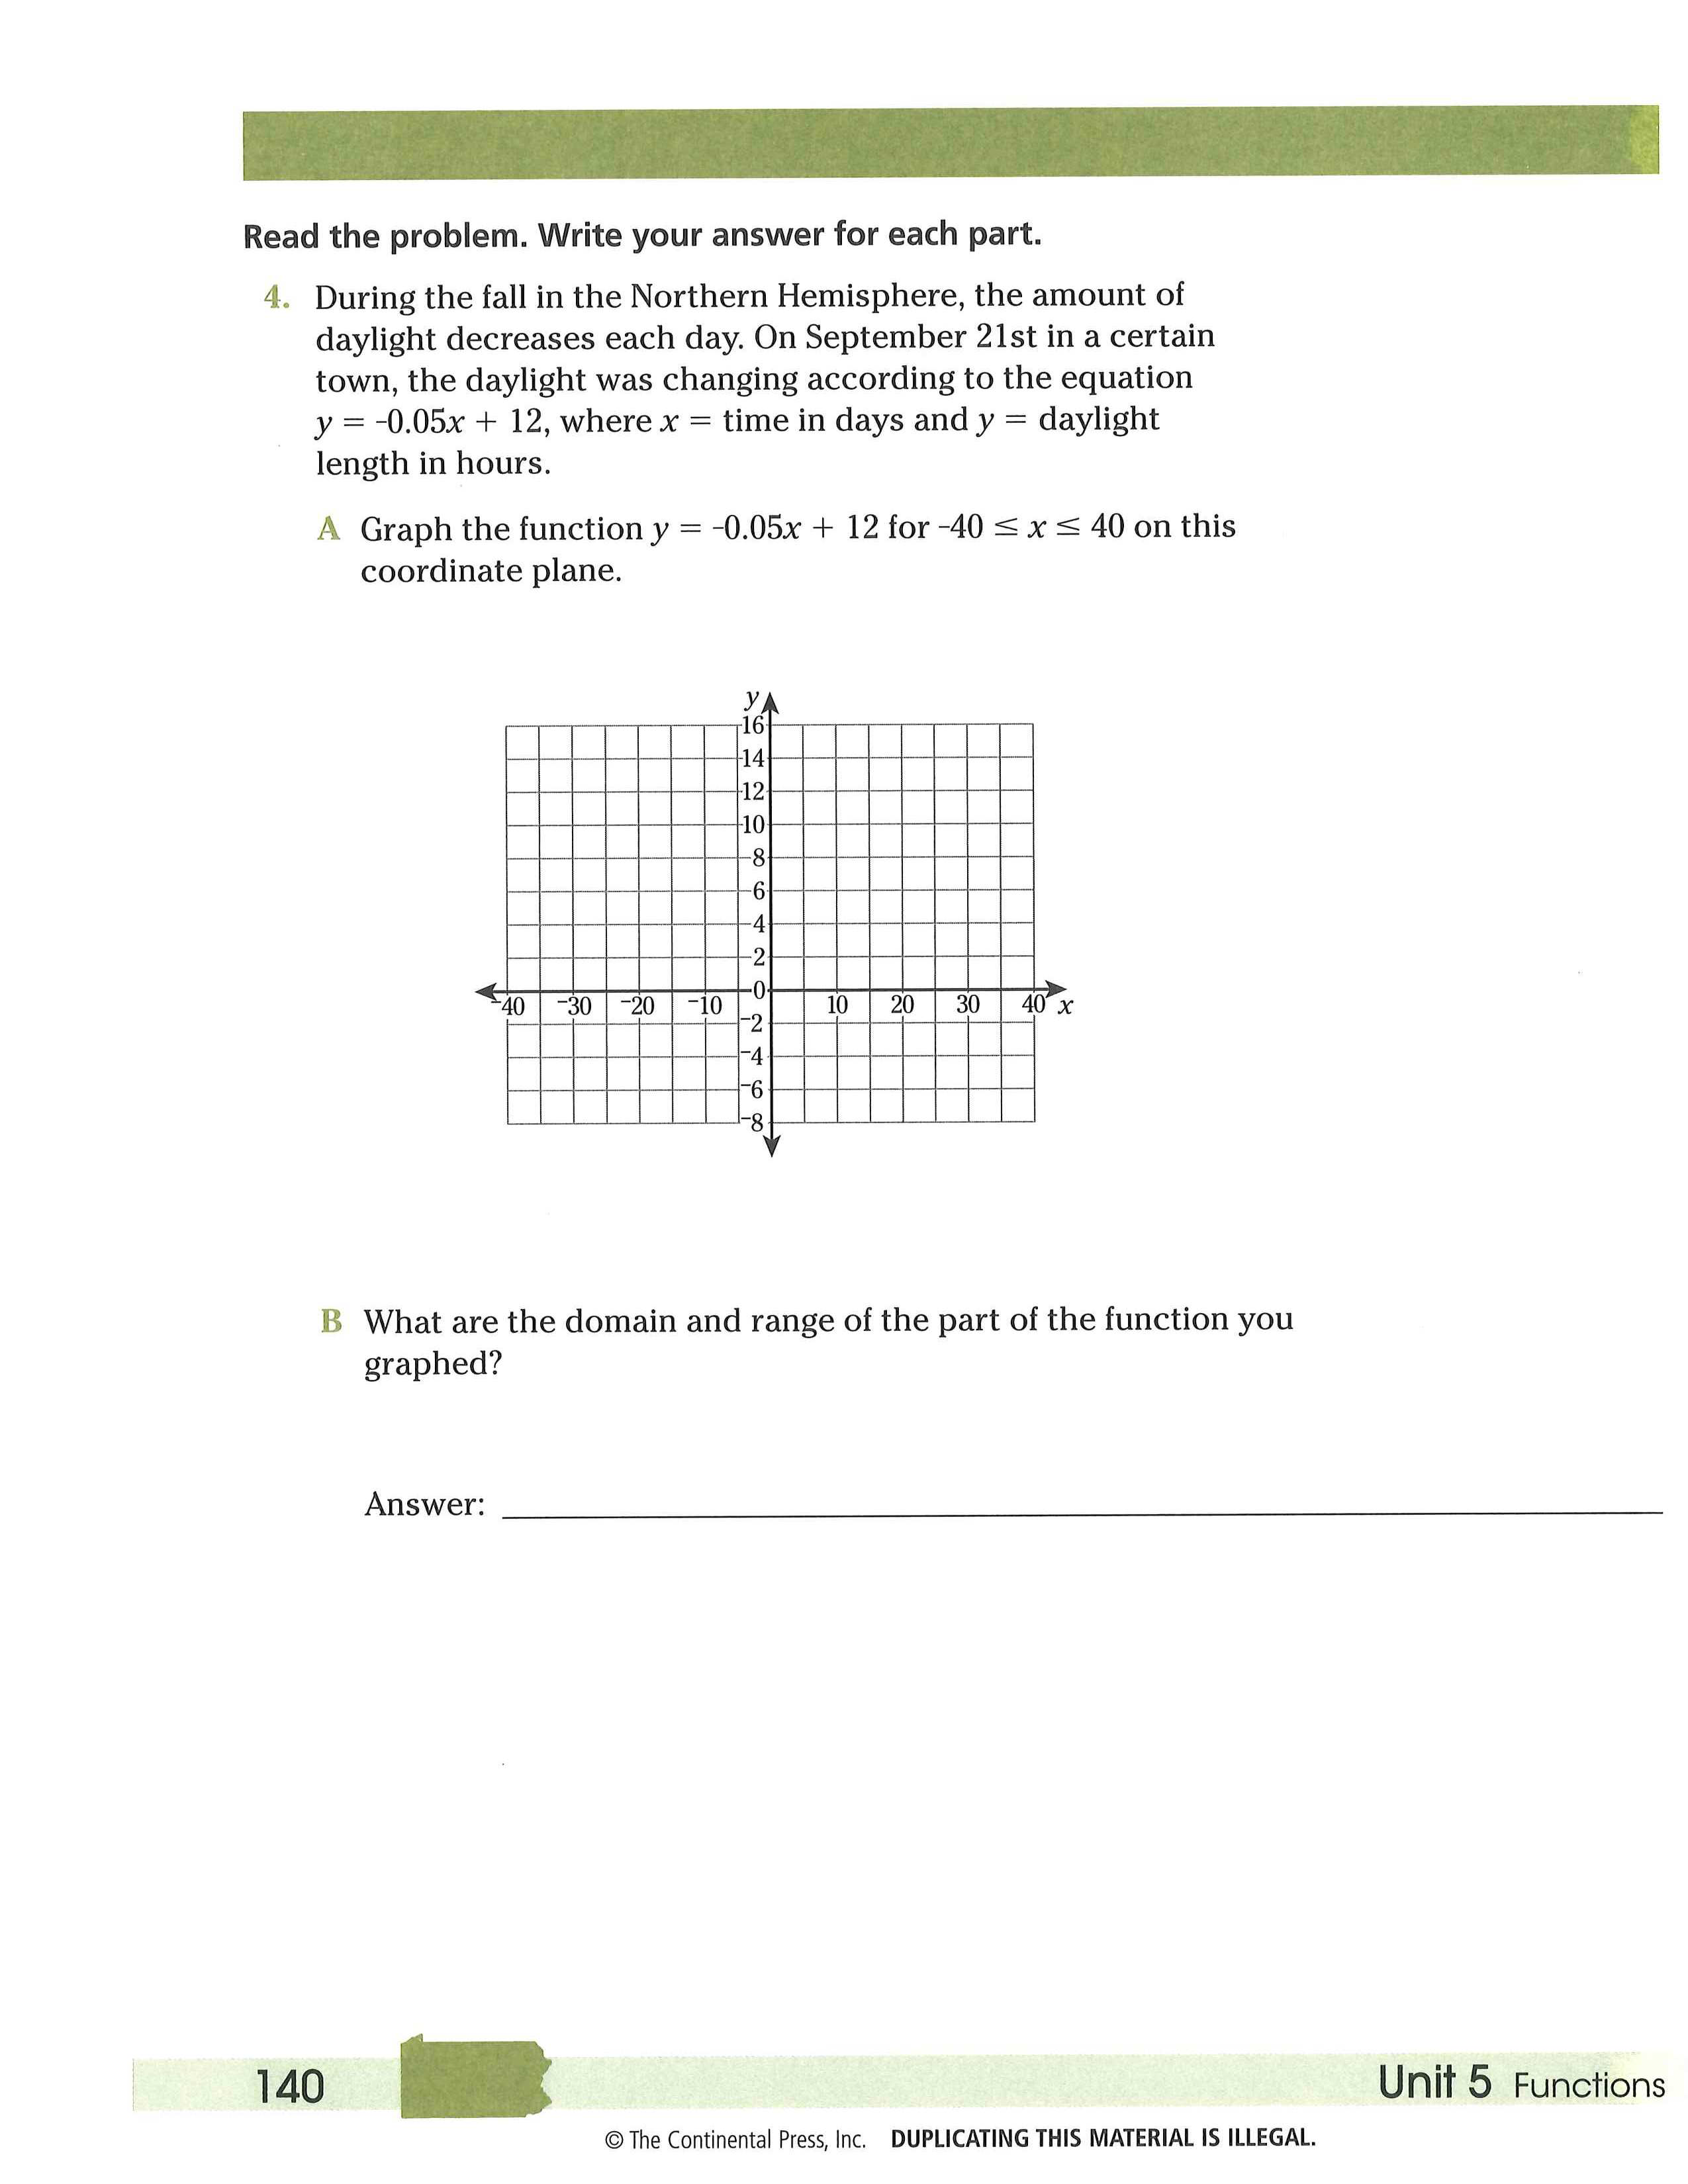
4a. Graph the function y = -0.05x + 12 for -40 ≤ x ≤ 40 on the coordinate plane.
4b. What are the domain and range of the part o fthe function you graphed?
4c. What is the meaning of the point on your graph where x = -40? Explain.
4d. Explain why the function y = -0.05x - 12 cannot describe the changing amount of daylight for an entire year.
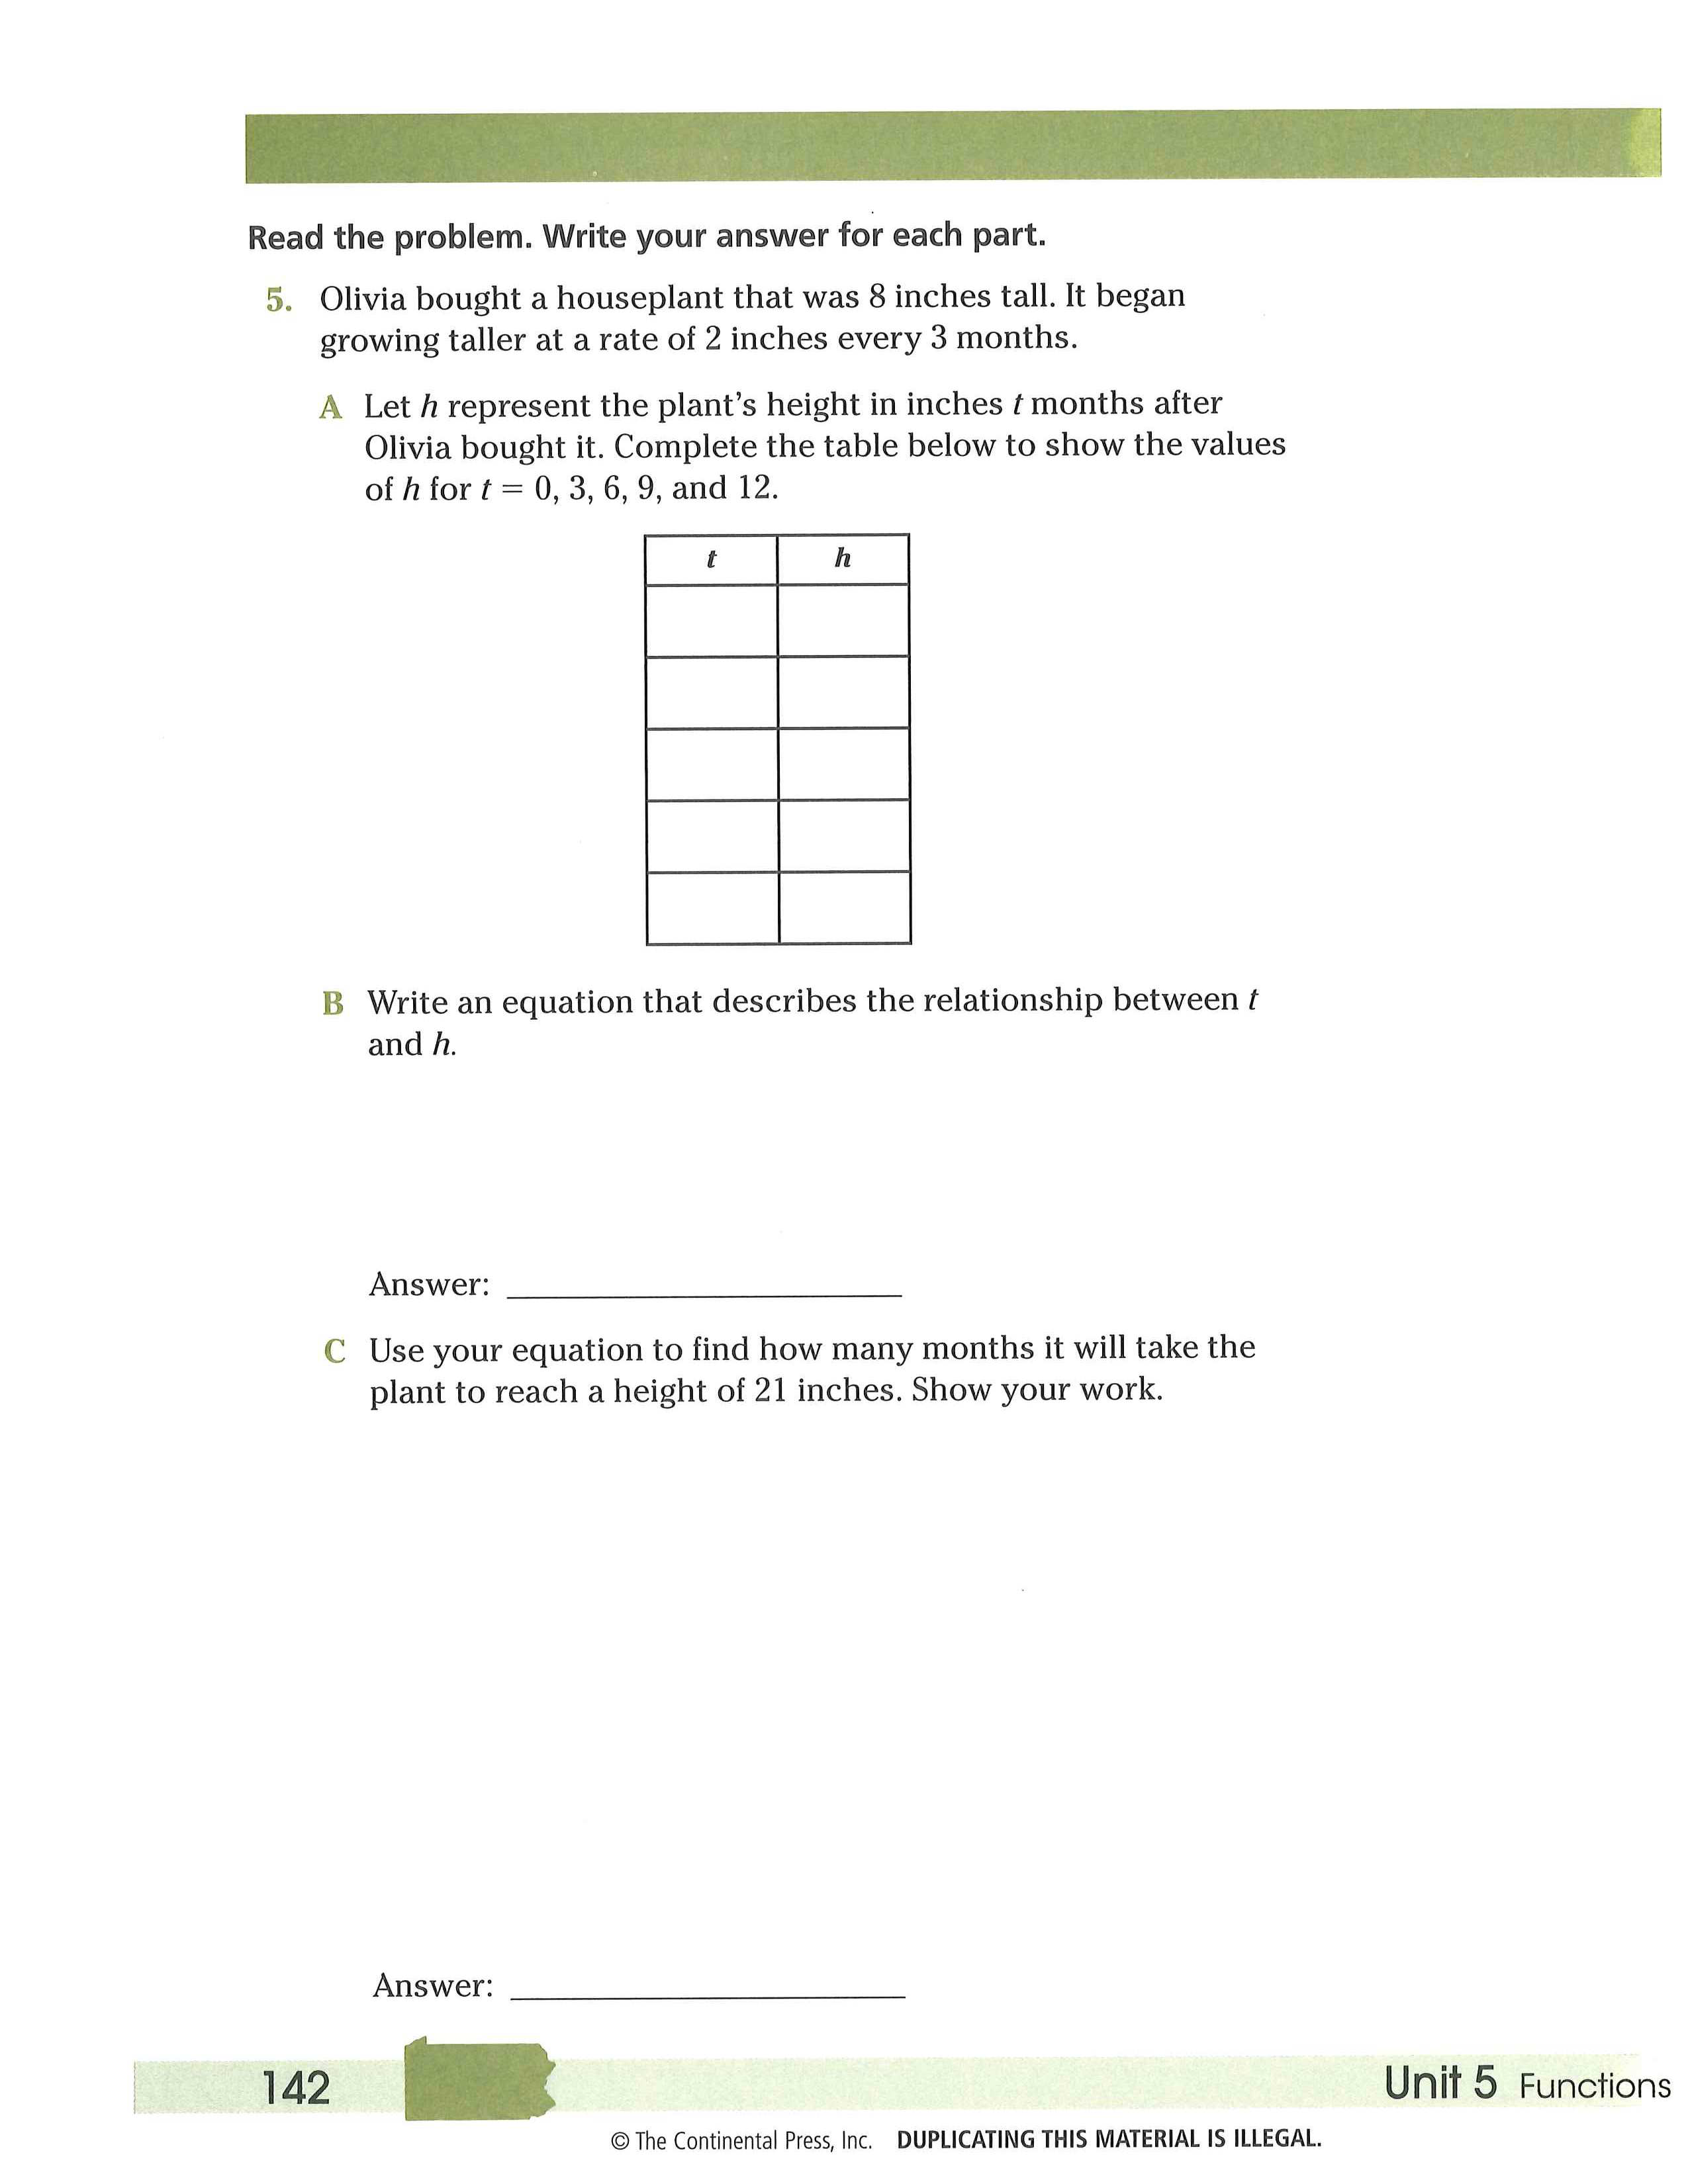
5a. Let h represent the plant's height in inches t months after Olivia bought it. Complete the table to show the values of h for t = 0,3, 6, 9, 12.
5b. Write an equation that describes the relationship between t and h.
5c. Use your equation to find how many months it will take the plant to reach a height of 21 inches. Show your work.
2.
3.
4.
6.
7.
2.
4.
5.
7.
8.
9.
2.
3.
5.
7.
9.