my F2: Production Possibilities Curve
star
star
star
star
star
Posljednje ažuriranje almost 6 years ago
5
Napomena autora:
Drawing production possibilities curve

1
SSEF6.d
1
SSEF6.d

1
SSEF6.d

1
SSEF6.d
1
SSEF6.d
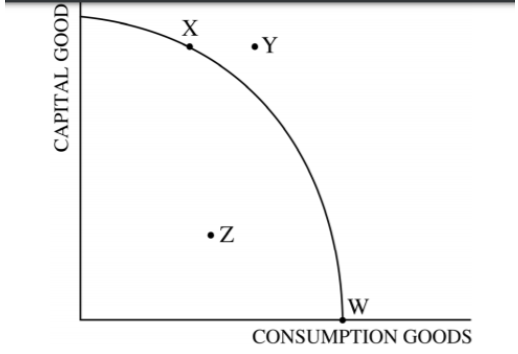
Drawing production possibilities curve
Which of the following points would best represent unemployment of resources
Which of the following BEST describes point Y?
Assume that this society is currently producing at combination X, where they are allocating more resources toward the production of capital goods (physical capital) than consumer goods (clothing, toys, etc.). Which of the following is the most likely result of the allocation choice?
The Production Possibilities Curve above shows the trade-off between a company's production of balls (Y-axis) and caps (X-axis). What is the opportunity cost of moving from point D to point C ?
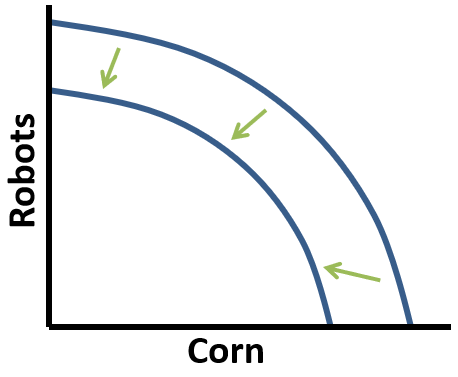
The leftward shift of the production possibilities curve suggests that