Math Spiral 4: Statistics & Probability
star
star
star
star
star
Posljednje ažuriranje almost 6 years ago
4 questions
5
Hint: Research histograms if you need help analyzing the data on the graph.
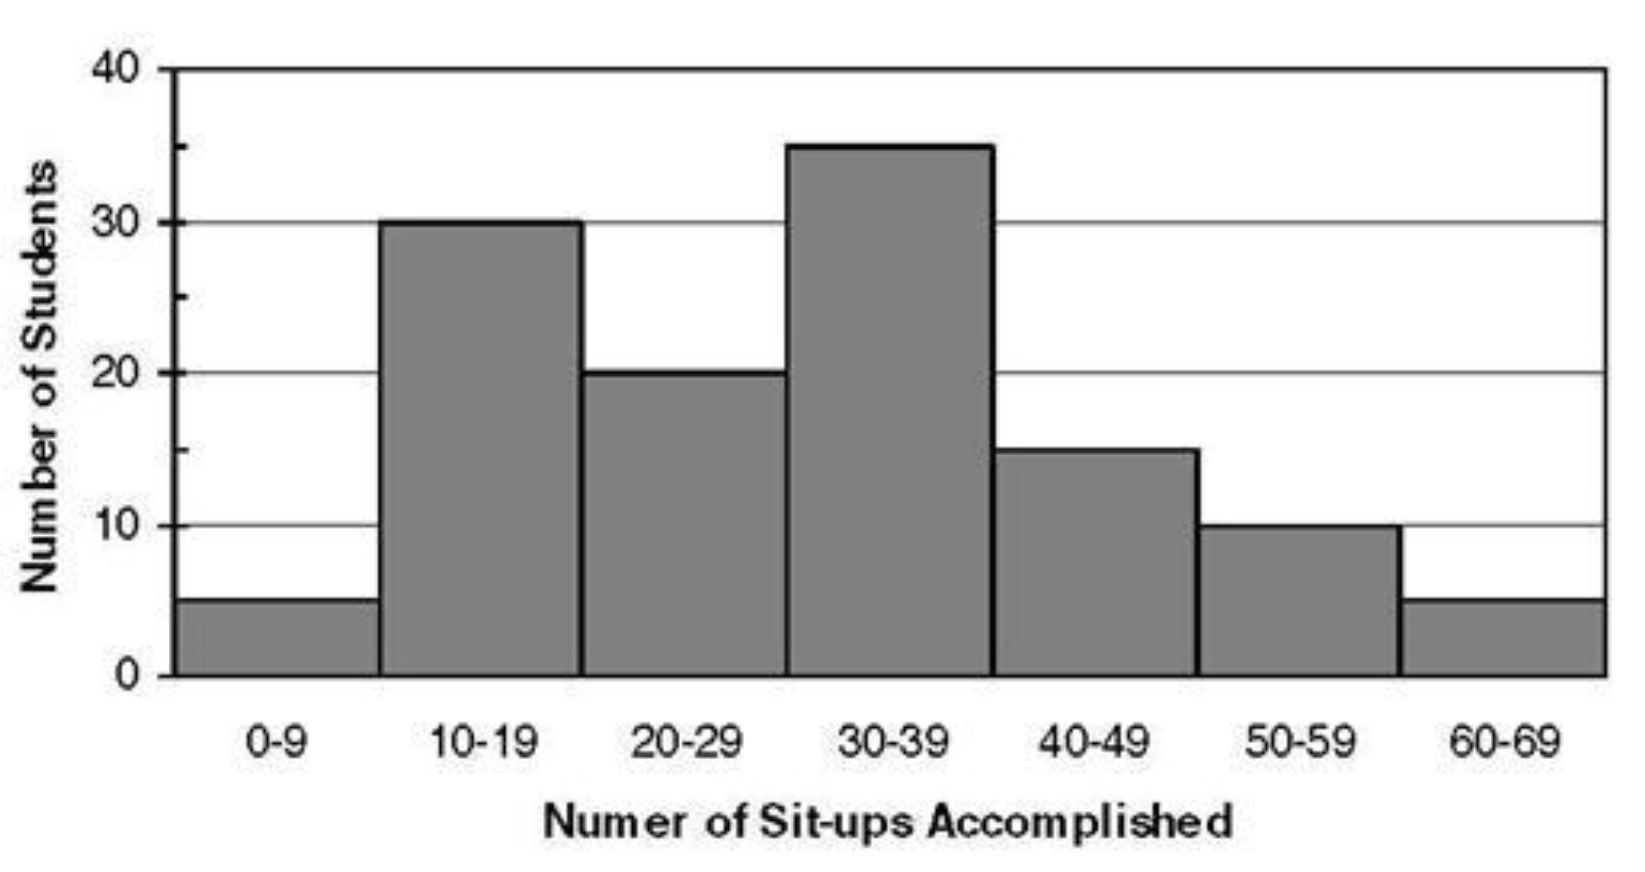
How many students did sit-ups?
Hint: Research histograms if you need help analyzing the data on the graph.
How many students did sit-ups?
5
Hint: Research histograms if you need help analyzing the data on the graph.
What was the most common range of sit-ups and least common range of sit-ups?
Hint: Research histograms if you need help analyzing the data on the graph.
What was the most common range of sit-ups and least common range of sit-ups?
5
Hint: Research types of data distribution if you need help analyzing the data on the graph.
What statement can you make about the distribution of data?
Hint: Research types of data distribution if you need help analyzing the data on the graph.
What statement can you make about the distribution of data?
5