Math Spiral 5: Statistics & Probability
star
star
star
star
star
Last updated almost 6 years ago
4 Nsɛmmisa
5
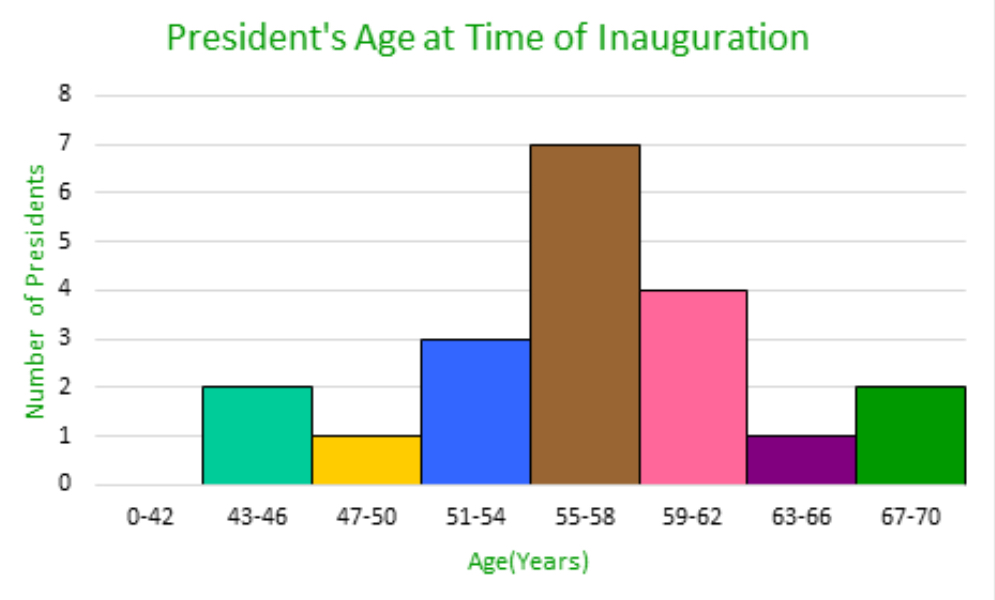
Answer the following question about the histogram. Hint: research histograms if you are having trouble analyzing the data from the graph.
How many presidents are represented?
Answer the following question about the histogram. Hint: research histograms if you are having trouble analyzing the data from the graph.
How many presidents are represented?
5
Answer the following question about the histogram. Hint: research histograms if you are having trouble analyzing the data from the graph.
What was the most common reported age of inauguration?
Answer the following question about the histogram. Hint: research histograms if you are having trouble analyzing the data from the graph.
What was the most common reported age of inauguration?
5
Answer the following question about the histogram. Hint: research histograms if you are having trouble analyzing the data from the graph.
What statement can you make about the distribution of data?
Answer the following question about the histogram. Hint: research histograms if you are having trouble analyzing the data from the graph.
What statement can you make about the distribution of data?
5