Graphing Assessment
star
star
star
star
star
Last updated almost 6 years ago
10 Nsɛmmisa
1
1
1
1
1
1
1
1
1
1
What kind of graph would you use to display the data for the following question:
How many dogs do my neighbors have?
___________ Data is a type of data that can be grouped into categories.
What is a question you could ask to get categorical data?
Draw an example of a bar graph using the tools.
What is a line graph?
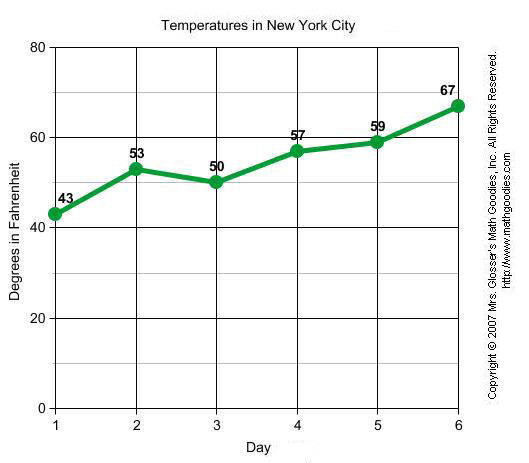
What was the temperature in New York City on day 3?
What was the difference between the temperature on day 6 and the temperature on day 5?
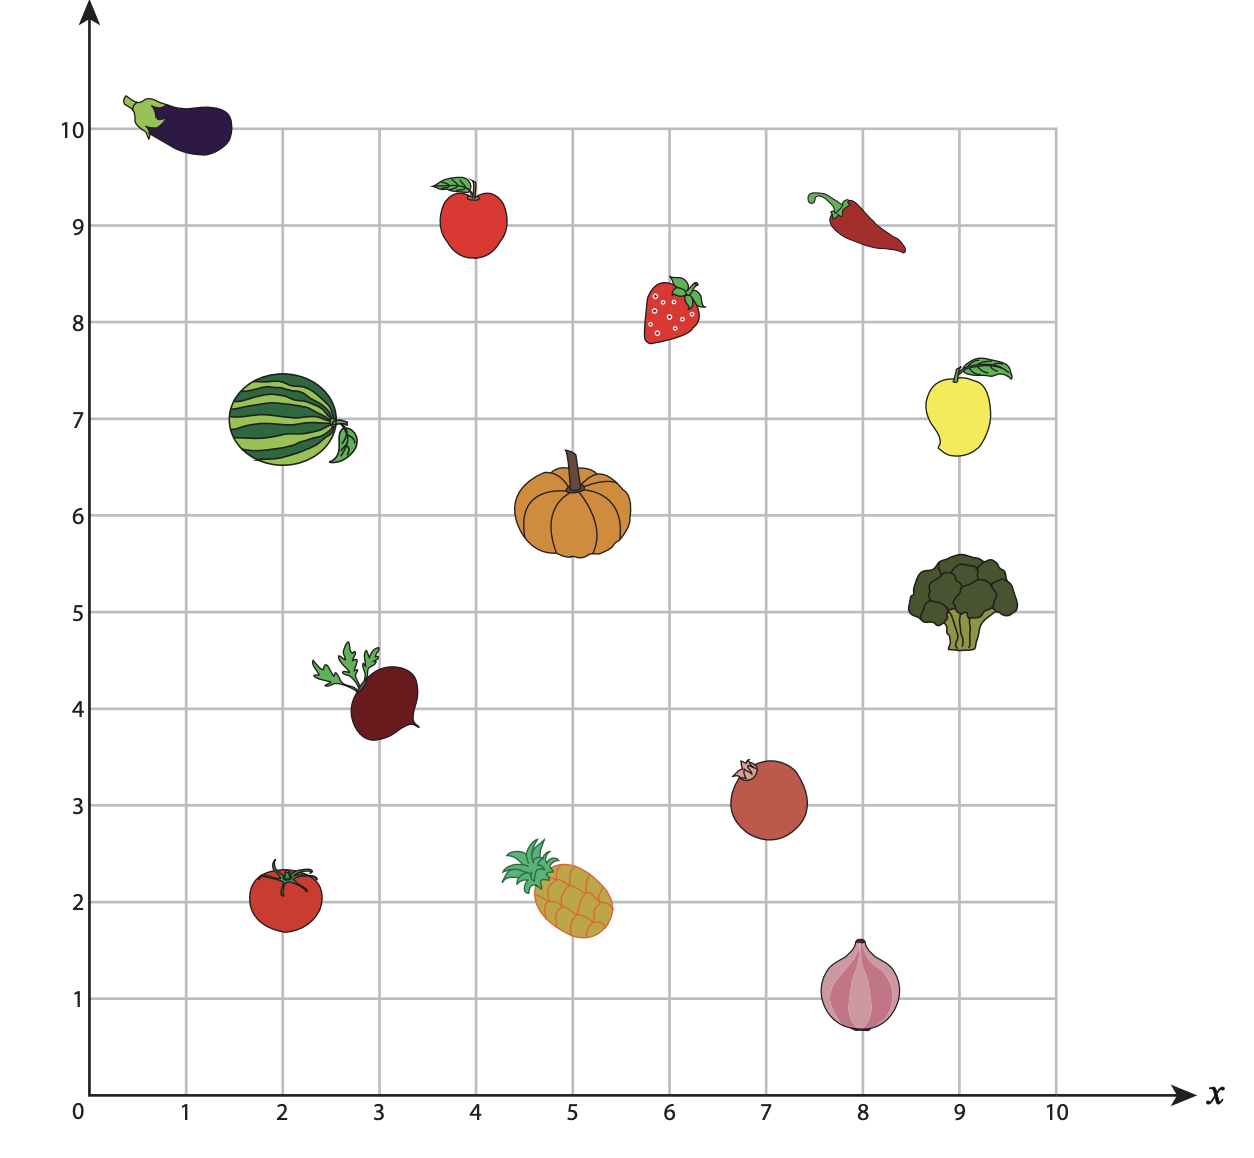
What are the coordinates of the pineapple? (x,y)
Which object is at the point (5, 6)?
Meredith made mystery shapes on a coordinate grid by listing the coordinates. Her friends had to connect the coordinates in order, connecting the last one to the first one. Which set of coordinates will make a rectangle?