Hot Wheels Lab ABSENT STUDENTS ONLY

Last updated almost 2 years ago
11 questions


Hot Wheels Lab

Learning Targets:
1. I can understand the relationship of kinetic energy to the mass of an object and the speed of an object.
2. I can plan and carry out scientific investigations/experiments.
- I can form a hypothesis.
- I can identify the independent and dependent variables
- I can identify constants.
- I can create a data table and graph from my results.
- I can analyze data from my results.
View the video below. Your teacher will be explaining how you set up scientific investigations/experiments. Next time we are in class with you, we will give you a copy of the handout we are discussing in the video. You can also print out a copy from our student resources on Canvas.
Watch the video below. In our experiment today we want to try and answer this question: Does the mass of my hot wheels car affect the amount of kinetic energy (energy in motion) it has? Does the speed of my hot wheels car affect the amount of kinetic energy it has?
0

For our experiment today, I want you to choose YOUR hypothesis below. Remember this is YOUR guess. There is no wrong answer at this point!

1

Remember, we need to set up an experiment, so first we need to identify our independent and dependent variables. I want you to identify what our INDEPENDENT VARIABLE is. Remember, your independent variable is what you manipulate or control. Don't worry if you get the wrong answer! If you put the wrong answer you should be able to see right away from the red circle on the answer bar above that you have recorded the wrong answer, and you can change it.

1

Now I want you to identify what our DEPENDENT VARIABLE is. Remember, your dependent variable is what you measure.

1

Now identify what our CONSTANTS are. Remember, these are the factors that we want to remain unchanged so they do not affect the outcome of the experiment.

Watch the quick demo videos below of your teacher performing the experiment.
Below are images of the data table from the two experiments we completed. The top table is for our experiment involving mass. We tested 5 different cars with different masses, and recorded the time they were moving once we hit the go button for our track.

The bottom table is for our experiment involving speed. We used our car called "Little Green Alien" and tested the car using four different track speeds, and recorded the time the car spent moving once we hit the go button for our track.
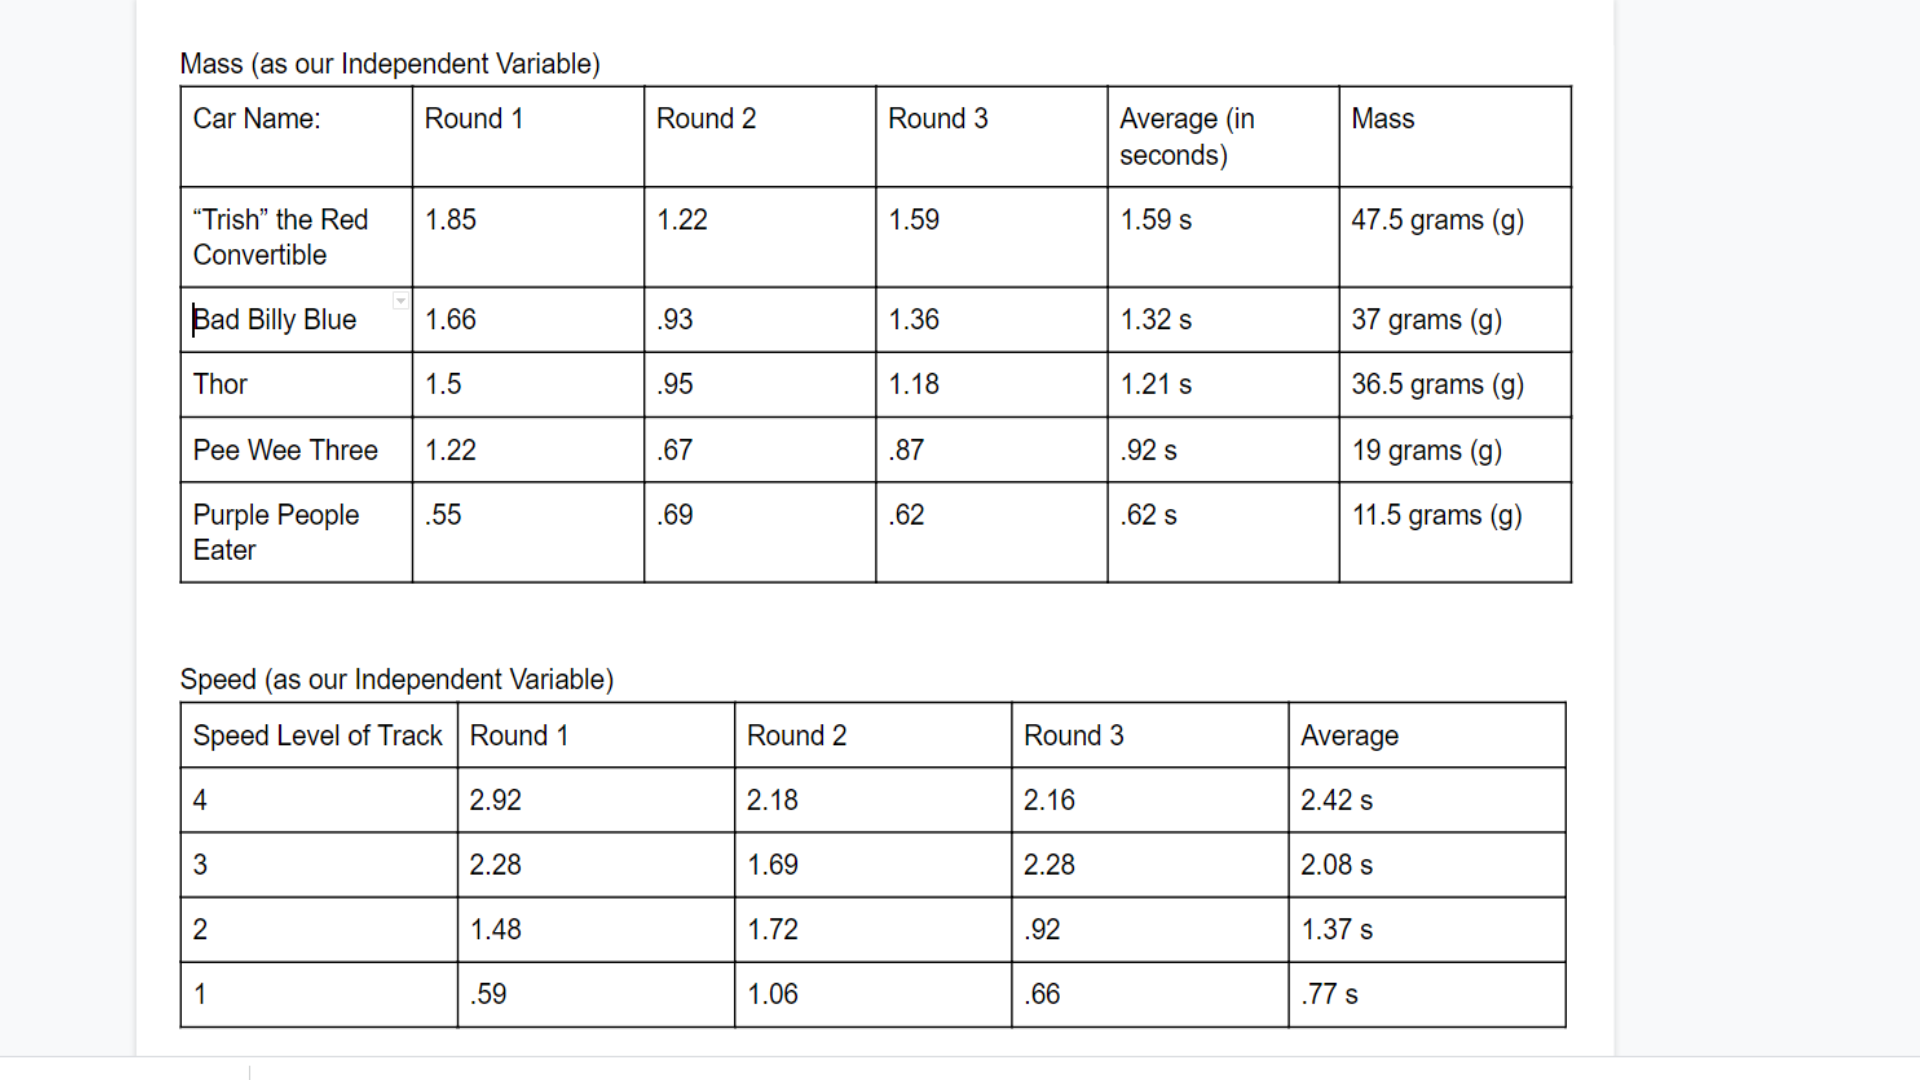
Below is the graph I made from data from our experiment involving mass. I used the data from the table you looked at above.
Below is the graph I made from data from our experiment involving track speeds. I used data from the table you looked at above.
Watch the video below so you can see me going over our graphs and tables in detail to analyze our data. After reviewing the data tables and graphs from our two experiments, attempt to answer the following questions below. Don't worry if you get the wrong answer! If you put the wrong answer you should be able to see right away from the red circle on the answer bar above that you have recorded the wrong answer, and you can change it.
1

For our experiment involving MASS (independent variable: mass of different cars, dependent variable: time cars spent in motion), did we find that the MORE mass a car was, the LONGER amount of time it spent in motion (kinetic energy)?

1

For our experiment involving MASS (independent variable: mass of different cars, dependent variable: time cars spent in motion), what car stayed in motion the longest (time in seconds)?

1

For our experiment involving SPEED (independent variable: 4 different track speeds of hot wheels ramp, dependent variable: time car spent in motion), did we find that the HIGHER the track speed was, the longer amount of time the car spent in motion (kinetic energy)?

1

For our experiment involving SPEED (independent variable: 4 different track speeds of hot wheels ramp, dependent variable: time car spent in motion), what speed (1-4) did the car remain in motion the longest (more time in seconds)?

0

Was your original hypothesis (scroll above if you already forgot what you guessed) supported or rejected by the data? If it is supported, that means you proved your hypothesis true with your data. If it is rejected, that means you did not prove your hypothesis to be true with the data.

1

In your own words, please describe what correlation (connection or relationship) you observed between the MASS of an object and its amount of kinetic energy? Does this match what you learned in your slides yesterday? Don't worry if you still don't quite understand- I just want to read what you know! We will discuss our results more next time we meet in class. :)

0

In your own words, please describe what correlation (connection or relationship) you observed between the SPEED of an object and its amount of kinetic energy? Does this match what you learned in your slides yesterday? Don't worry if you still don't quite understand- I just want to read what you know! We will discuss our results more next time we meet in class. :)