8.6.B.8 - Informally Fitting a Line – Exit Ticket
star
star
star
star
star
Posljednje ažuriranje over 5 years ago
3 questions
10
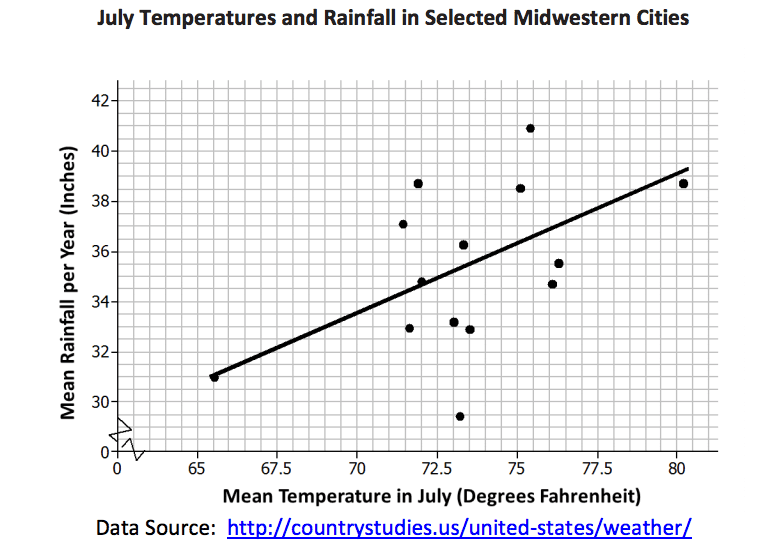
Choose a point in the scatter plot and explain what it represents.
Choose a point in the scatter plot and explain what it represents.
10
Use the line provided to predict the mean number of inches of rain per year
for a city that has a mean temperature of 70°F in July.
Use the line provided to predict the mean number of inches of rain per year for a city that has a mean temperature of 70°F in July.
10