Math Spiral (4-6) Quiz: Statistics & Probability
star
star
star
star
star
Posljednje ažuriranje almost 6 years ago
4 questions
5
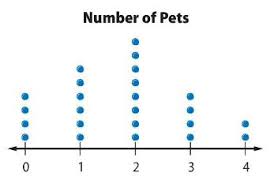
Directions: Analyze the dot plot in order to answer the question.
How many peogle were surveyed?
Directions: Analyze the dot plot in order to answer the question.
How many peogle were surveyed?
5
Directions: Analyze the dot plot in order to answer the question.
What was the most common number of pets?
Directions: Analyze the dot plot in order to answer the question.
What was the most common number of pets?
5
Directions: Analyze the dot plot in order to answer the question.
What statement can you make about the distribution of data?
Directions: Analyze the dot plot in order to answer the question.
What statement can you make about the distribution of data?
5