PART II: Answer the question in this part. Each correct answer will receive
2 credits. Clearly indicate the necessary steps, including appropriate formula substitutions, diagrams, graphs, charts, etc. Utilize the information provided to determine your answer. Not that diagrams are not necessarily drawn to scale. A correct numerical answer with no work shown will receive only
1 credit. All answers should be written in pen, except for graphs and drawings, which should be done in pencil.
Solve algebraically for x .
If C = G - 3F , find the trinomial that represents C when
F = 2x2 + 6x - 5 and G = 3x2 + 4 .
Graph the following piecewise function on the set of axes provided.
Solve 5x2 = 180 algebraically.
A blizzard occurred on the East Coast during January, 2016. Snowfall totals from the storm were recorded for Washington, D. C. and are shown in this table.
Which interval, 1 a.m. to 12 noon or 6 a.m. to 3 p.m., has the greatest rate of snowfall, in inches per hour? Justify your answer.
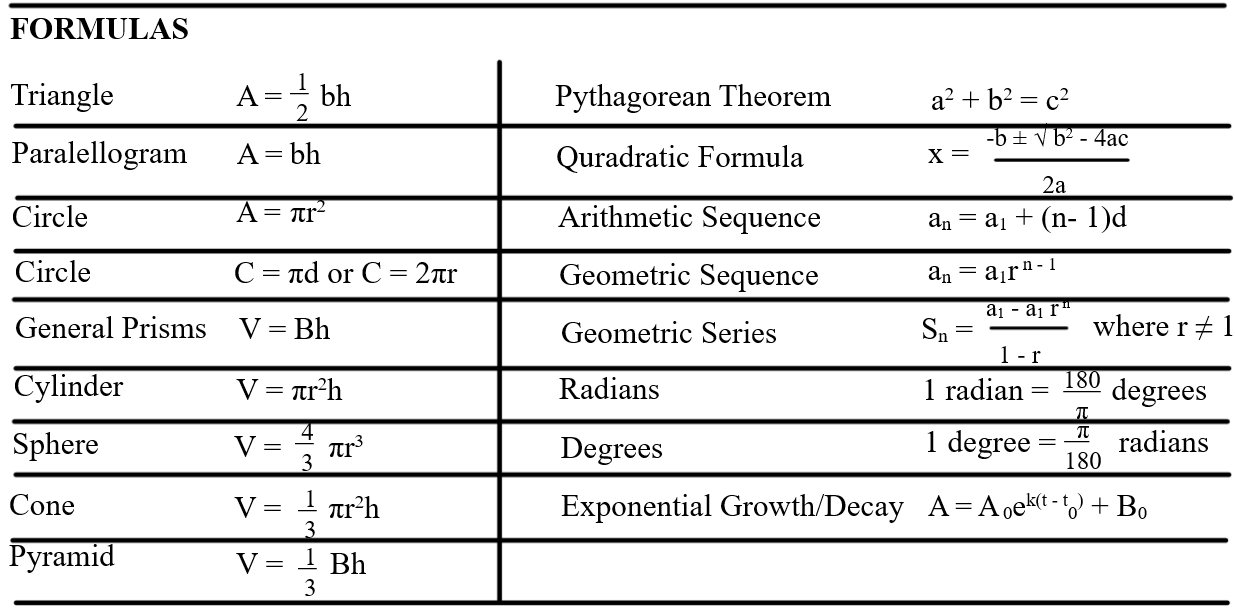
The formula for the volume of a cone is
Solve the equation for h in terms of V , r , and Pi .
Given the recursive formula:
a1 = 3
an = 2(an - 1 + 1)
State the values of a2 , a3 , and a4 for the given recursive formula.
Determine and state the vertex of
f(x) = x2 - 2x - 8
using the method of completing the square.
PART III: Answer the question in this part. Each correct answer will receive
4 credits. Clearly indicate the necessary steps, including appropriate formula substitutions, diagrams, graphs, charts, etc. Utilize the information provided to determine your answer. Not that diagrams are not necessarily drawn to scale. A correct numerical answer with no work shown will receive only
1 credit. All answers should be written in pen, except for graphs and drawings, which should be done in pencil.
A school plans to have a fundraiser before basketball games selling shirts with their school logo. The school contacted two companies to find out how much it would cost to have the shirts made. Company A charges a $50 set-up fee and $5 per shirt. Company B charges a $25 set-up fee and $6 per shirt.
Write an equation for Company A that could be used to determine the total cost, A , when x shirts are ordered.
A school plans to have a fundraiser before basketball games selling shirts with their school logo. The school contacted two companies to find out how much it would cost to have the shirts made. Company A charges a $50 set-up fee and $5 per shirt. Company B charges a $25 set-up fee and $6 per shirt.
Write a second equation for Company B that could be used to determine the total cost, B , when x shirts are ordered.
A school plans to have a fundraiser before basketball games selling shirts with their school logo. The school contacted two companies to find out how much it would cost to have the shirts made. Company A charges a $50 set-up fee and $5 per shirt. Company B charges a $25 set-up fee and $6 per shirt.
Determine algebraically and state the minimum number of shirts that must be ordered for it to be cheaper to use Company A .
Graph y = f(x) and y = g(x)
on the set of axes provided.
f(x) = 2x2 - 8x + 3
g(x) = -2x + 3
Determine and state all values of x for which f(x) = g(x) .
The table provided shows the number of hours ten students spent studying for a test and their scores.
Write the linear regression equation for this data set. Round all values to the nearest hundredth .
The table provided shows the number of hours ten students spent studying for a test and their scores.
State the correlation coefficient of this line, to the nearest hundredth .
The table provided shows the number of hours ten students spent studying for a test and their scores.
Explain what the correlation coefficient suggests in the context of the problem.
A system of inequalities is graphed on the set of axes provided.
State the system of inequalities represented by the graph.
A system of inequalities is graphed on the set of axes provided.
State what region A represents.
A system of inequalities is graphed on the set of axes provided.
State what the entire gray region represents.
PART IV: Answer the question in this part. Each correct answer will receive
6 credits. Clearly indicate the necessary steps, including appropriate formula substitutions, diagrams, graphs, charts, etc. Utilize the information provided to determine your answer. Not that diagrams are not necessarily drawn to scale. A correct numerical answer with no work shown will receive only
1 credit. All answers should be written in pen, except for graphs and drawings, which should be done in pencil.
When visiting friends in a state that has no sales tax, two families went to a fast-food restaurant for lunch. The Browns bought 4 cheeseburgers and 3 medium fries for $16.53. The Greens bought 5 cheeseburgers and 4 medium fries for $21.11.
Using c for the cost of a cheeseburger and f for the cost of medium fries, write a system of equations that models this situation.
When visiting friends in a state that has no sales tax, two families went to a fast-food restaurant for lunch. The Browns bought 4 cheeseburgers and 3 medium fries for $16.53. The Greens bought 5 cheeseburgers and 4 medium fries for $21.11.
The Greens said that since their bill was $21.11, each cheeseburger must cost $2.49 and each order of medium fries cost $2.87 each. Are they correct? Justify your answer.
When visiting friends in a state that has no sales tax, two families went to a fast-food restaurant for lunch. The Browns bought 4 cheeseburgers and 3 medium fries for $16.53. The Greens bought 5 cheeseburgers and 4 medium fries for $21.11.
Using your equations, algebraically determine both the cost of one cheeseburger and the cost of one medium fries.