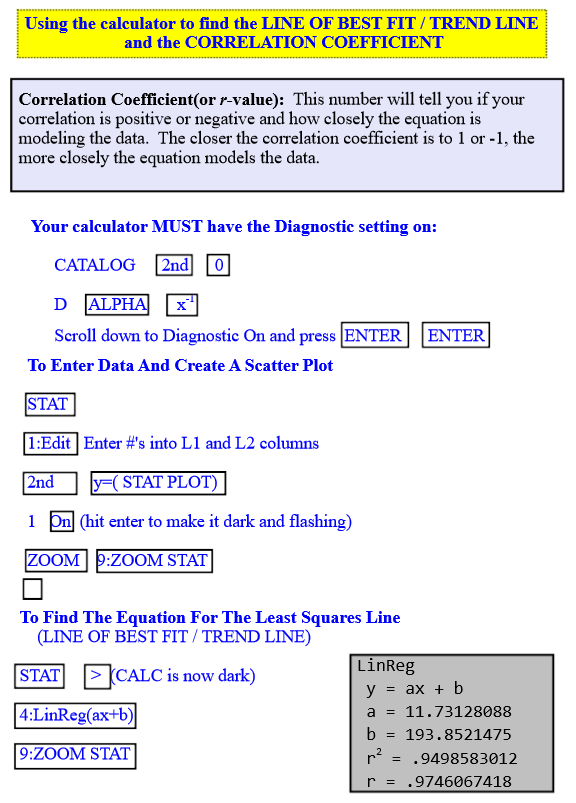
Complete the scatter plot below. Find the Line of Best Fit and the Correlation Coefficient.
Complete the scatter plot below. Find the Line of Best Fit and the Correlation Coefficient.
Complete the scatter plot below. Find the Line of Best Fit and the Correlation Coefficient.
Complete the scatter plot below. Find the Line of Best Fit and the Correlation Coefficient.
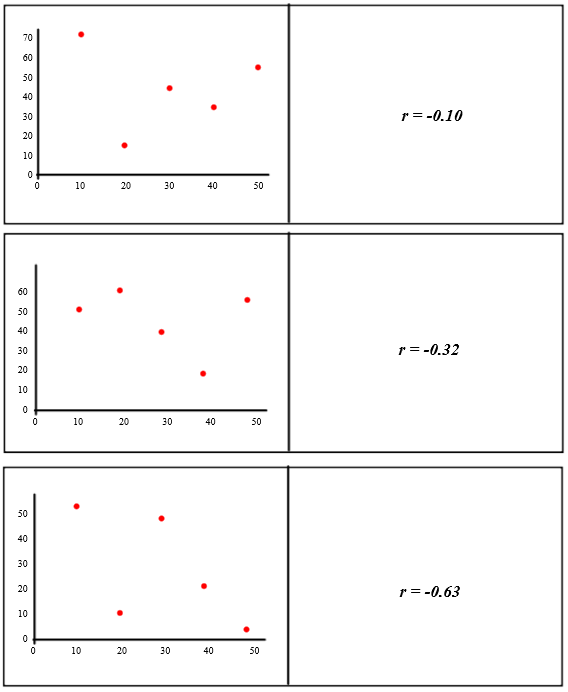
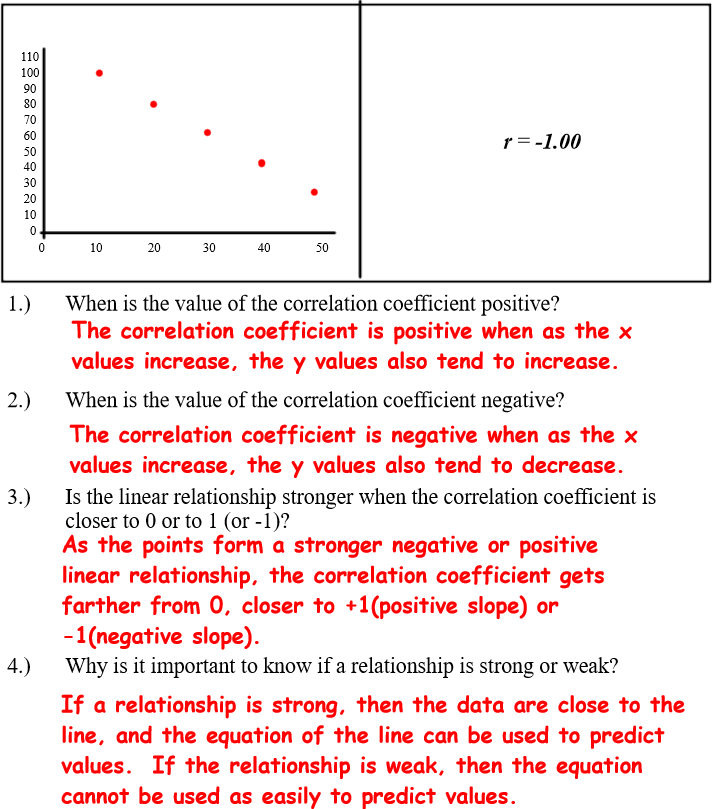
Below there are six scatter plots, six correlation coefficients, and six terms. Match the appropriate r-value with the scatter plot it most likely corresponds to. Then match the term you think is most appropriate to the r-value as well (not to the graph). Use different colors for each matched set to link all 3 together.


