Populations in Serengeti
star
star
star
star
star
Last updated about 1 year ago
19 Nsɛmmisa
1
1
1
1
1
1
1
1
1
1
1
1
1
1
1
1
1
1
1
Serengeti National Park covers a large region (14,570 km2 ) in central Africa and is home to many species of animals. List some of the animals you would expect to find in the park.
Fill in the chart according to the directions above.
This case study focuses on two important herbivores in the Serengeti: buffalo and wildebeest. Their populations are strongly affected by certain bottom-up factors. Which of the following is a bottom-up factor that could impact the population sizes of these herbivores?
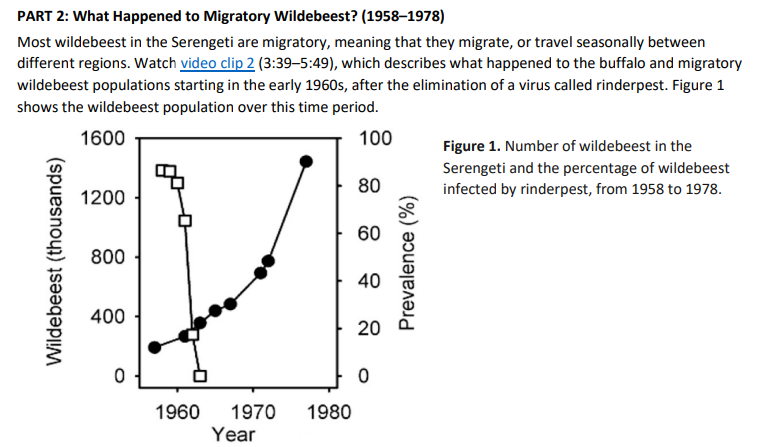
In Figure 1, which symbol (unshaded square or shaded circle) represents the number of wildebeest, and which represents the percentage (“prevalence”) of wildebeest with rinderpest? How do you know?
The elimination of rinderpest impacted the wildebeest population. What type of factor is rinderpest?
Consider the growth curve of the wildebeest population shown in Figure 1. Which of the following best describes this type of growth?
Predict what would happen to the wildebeest population in the long term given this type of growth.
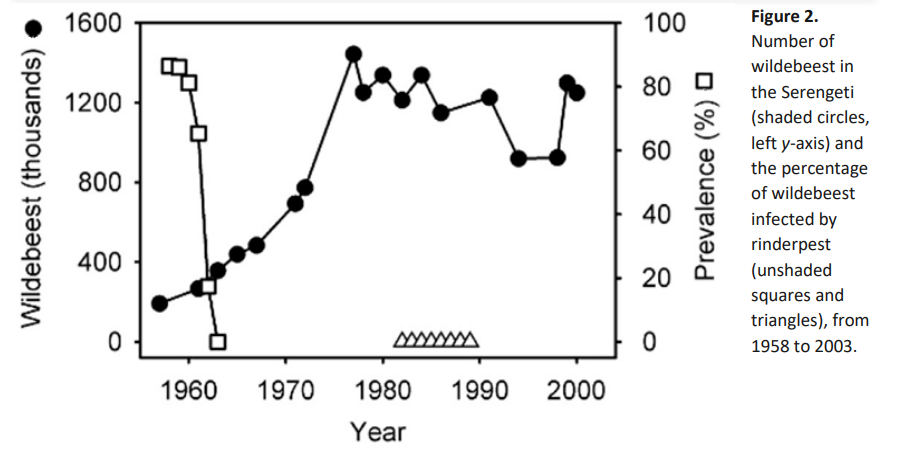
Consider the entire growth curve for the wildebeest population shown in Figure 2. Which of the following best describes this type of growth?
Based on Figure 2, what is the wildebeest population’s approximate carrying capacity (the largest size of a population that the environment can support in the long run)?
In 1958, the wildebeest population was relatively small due to rinderpest. What factors may have affected the size of the wildebeest population from around 1980 to 2000? Were these factors likely to be density-dependent or density-independent? Why?
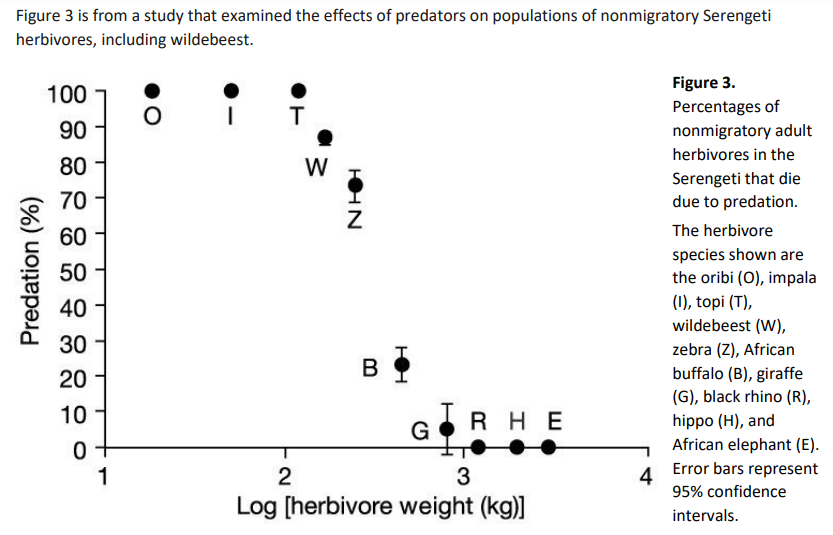
What might explain the relationship between predation and herbivore weight shown in Figure 3?
Some of the herbivore populations in Figure 3 have very few deaths, if any, due to predation. What factors are likely to limit the sizes of these populations?
Approximately what percentage of nonmigratory wildebeest deaths are caused by predation?
Which of the following data best supports the idea that migratory wildebeest are limited by bottom-up factors?
Migratory wildebeest populations are limited mainly by factors that are:
Nonmigratory wildebeest populations are limited mainly by factors that are:
Explain why nonmigratory and migratory wildebeest populations are limited by different types of factors.
Wildebeest aren’t the only animals that migrate in the Serengeti. What factors might limit migratory versus nonmigratory populations of other animals in the Serengeti, such as zebras? (Hint: You may want to look at Figure 3 again.)
Think of a population outside the Serengeti that you are familiar with, maybe one that lives near you. What factors do you think limit the size and growth of the population you chose? Why?