Chapter 1 Test
star
star
star
star
star
Last updated over 5 years ago
11 Nsɛmmisa
Hyɛ no nsow a efi ɔkyerɛwfo no hɔ:
AP Statistics Chapter 1 Test
The Practice of Statistics, 4th edition Resources
1
1

1
1
1
1
1
1
5
2
6
AP Statistics Chapter 1 Test
The Practice of Statistics, 4th edition Resources
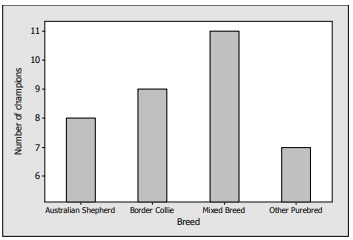
Which of the following statement can be made on the basis of this graph?
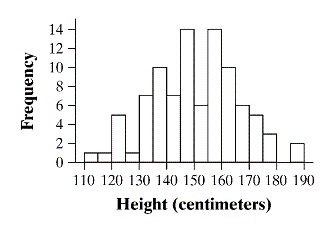
Which of the following descriptions best fits this distribution?
The population of the United States is aging, though less rapidly than in other developed countries. Above is a stemplot of the percents of residents aged 65 and older in each of the 50 states, according to the 2000 census. There are two outliers: Alaska has the lowest percent of older residents, and Florida has the highest. What is the percent for Florida?
The Interquartile range for the distribution of 50 states in the previous question is:
Which of the following statements is NOT true?
If a distribution is skewed to the left, which of the following is true?
The mean birth weight of infants born at a certain hospital in the month of April was 128 oz. with a standard deviation of 10.2 oz. Which of the following is a correct interpretation of standard deviation?
The five-number summary for scores on a statistics exam is 11, 35, 61, 70, 79. In all, 380 students took the test. About how many had scores between 35 and 61?
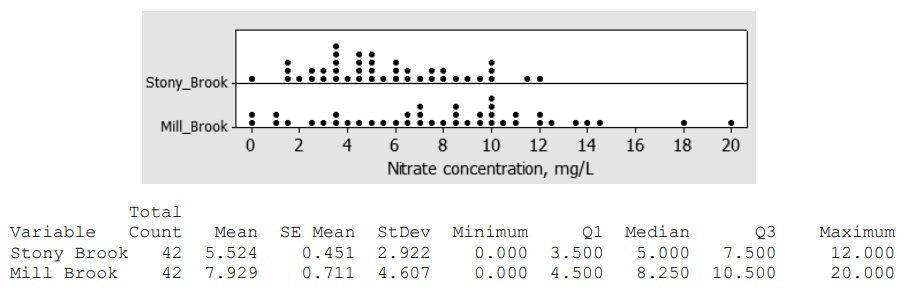
Nitrates are organic compounds that are a substantial component of agricultural fertilizers. When those fertilizers run off into streams, the nitrates can have a toxic effect on animals that live in those streams. An ecologist studying nitrate pollution in two streams collects data on nitrate concentrations at 42 places on Stony Brook and 42 places on Mill Brook. His results are given in the dotplots and computer output below.
Refer to the Nitrate Concentration scenario.
Determine if there are any outliers in each distribution. Show your work.
Draw parallel boxplots of these two distributions. Be sure to use the appropriate tools, such as the shapes, label the plots and provide a scale. Use red for Stony Brook and blue for Mill Brooke.
.
Write a few sentences comparing the two streams distributions . Remember to use the SOCS, include context and use comparative language.