Creating Box Plots
star
star
star
star
star
Last updated almost 6 years ago
11 Nsɛmmisa
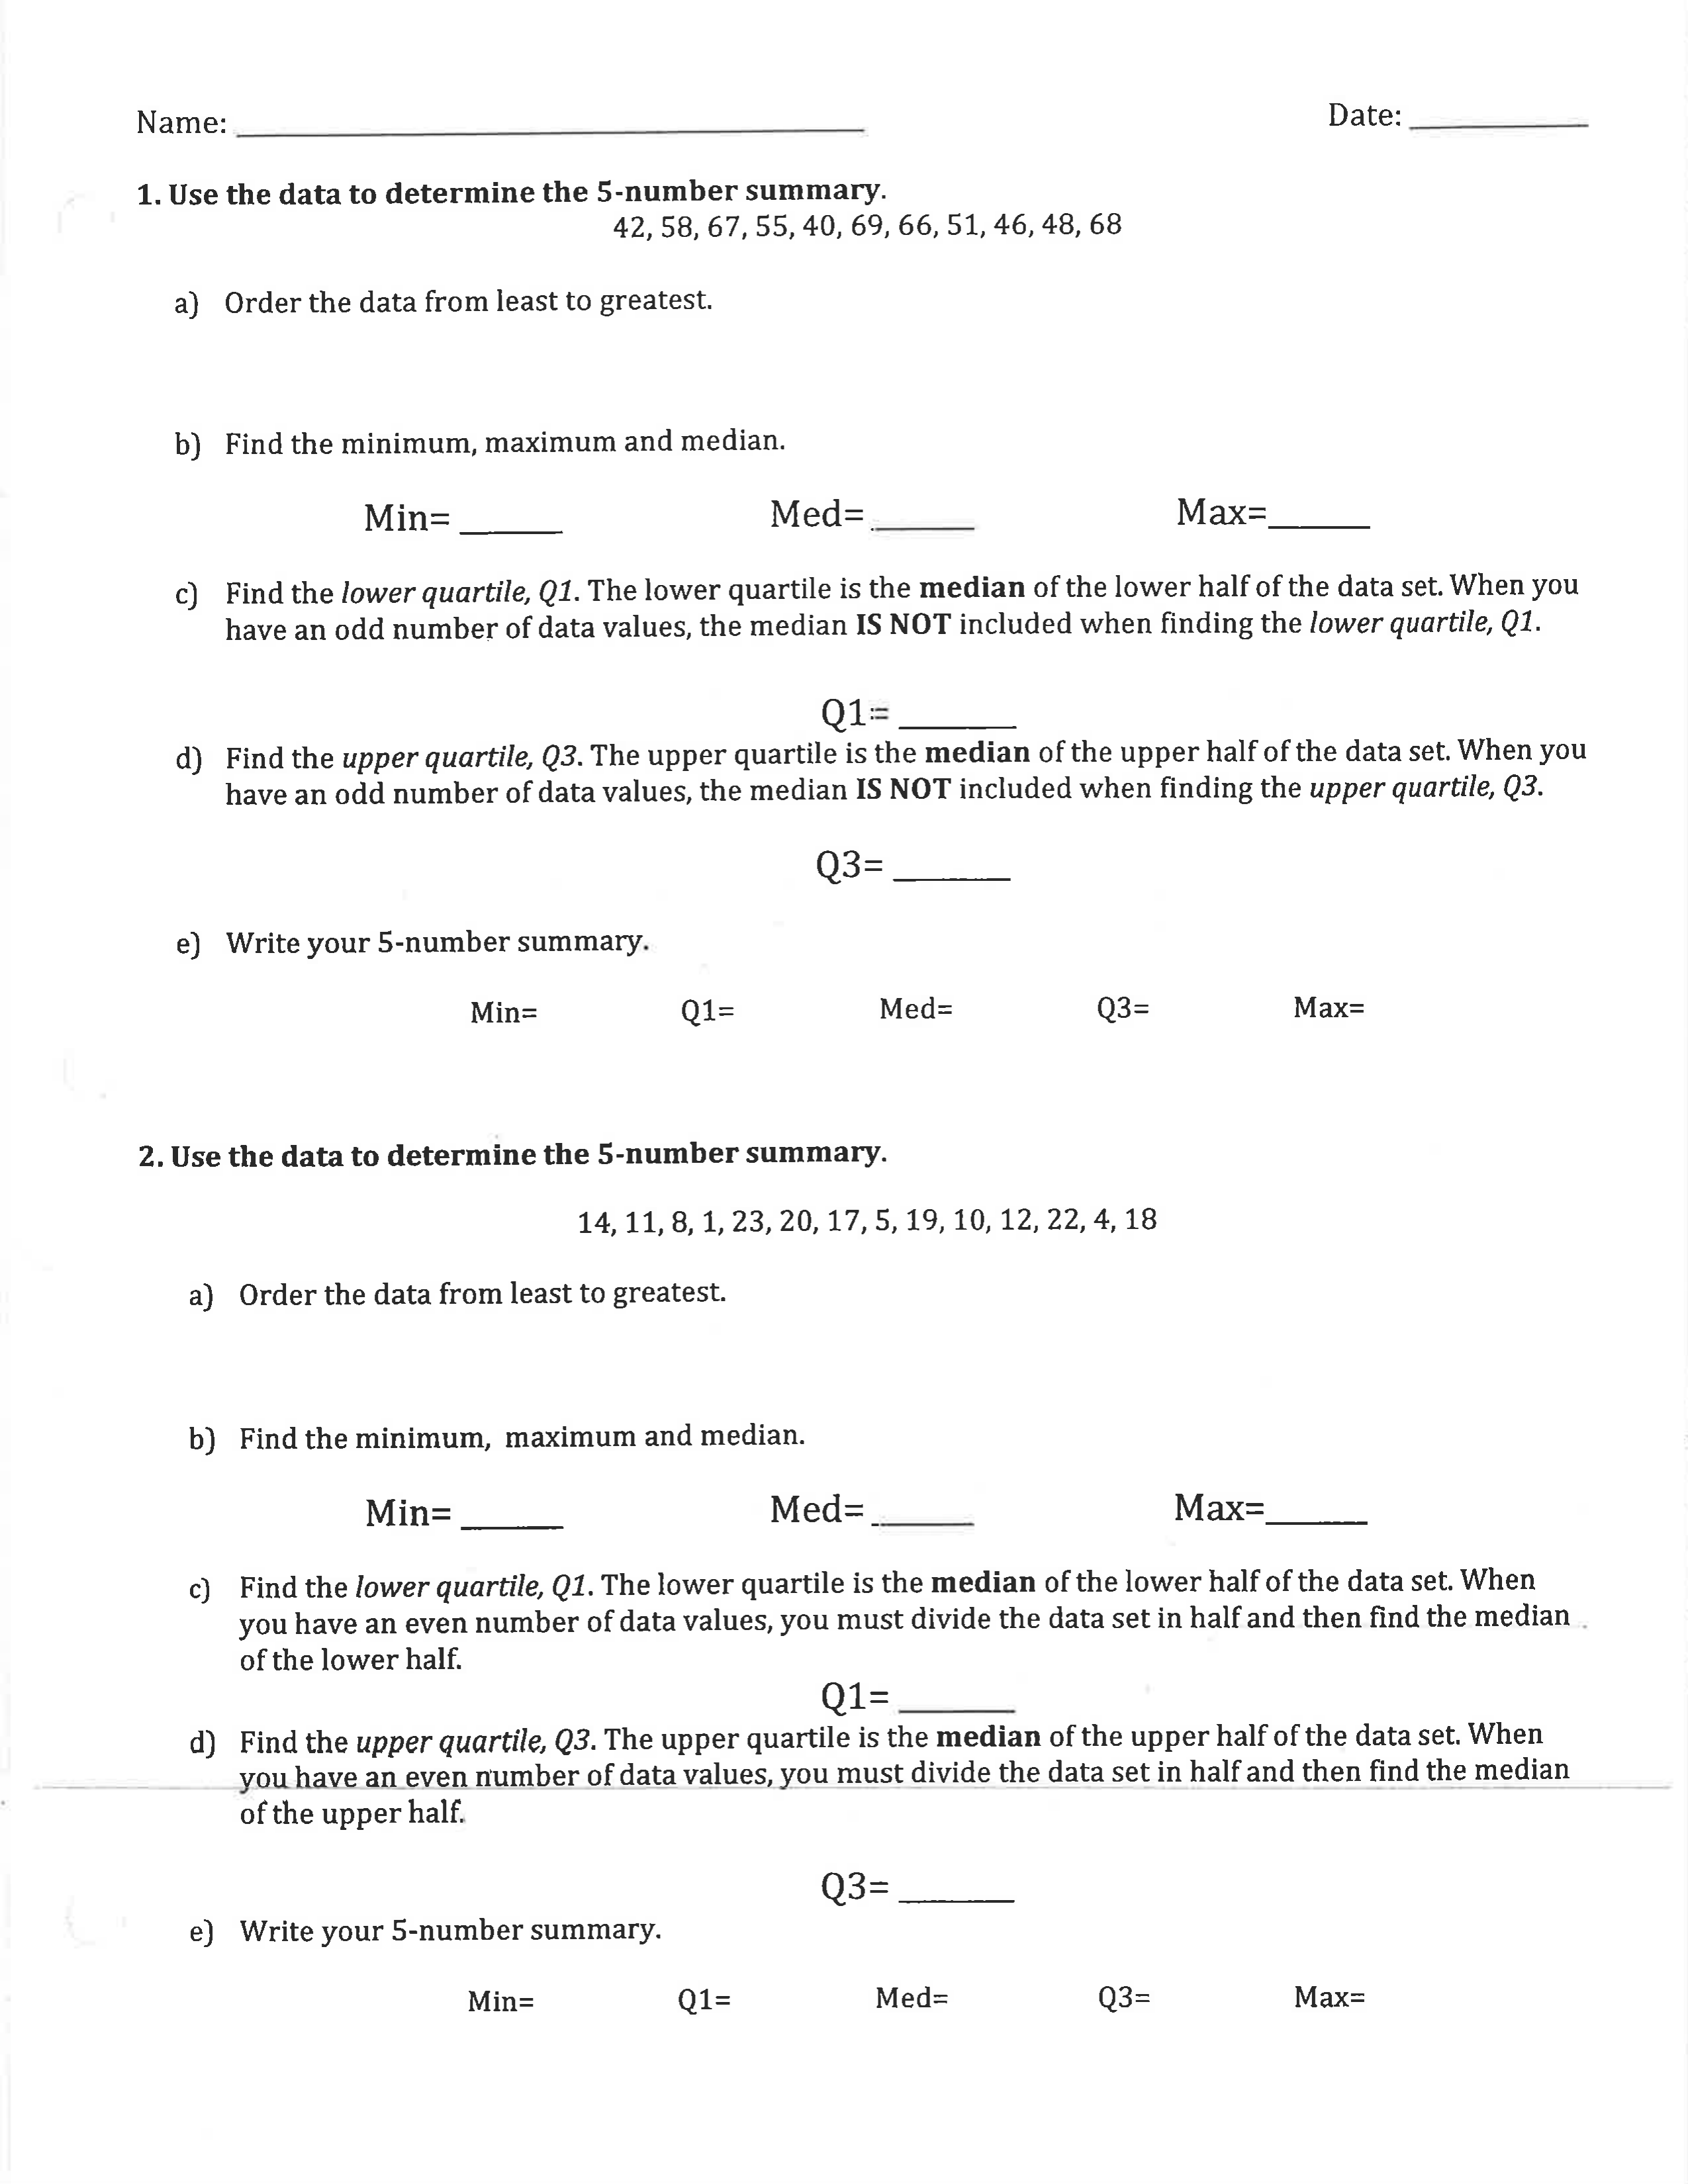
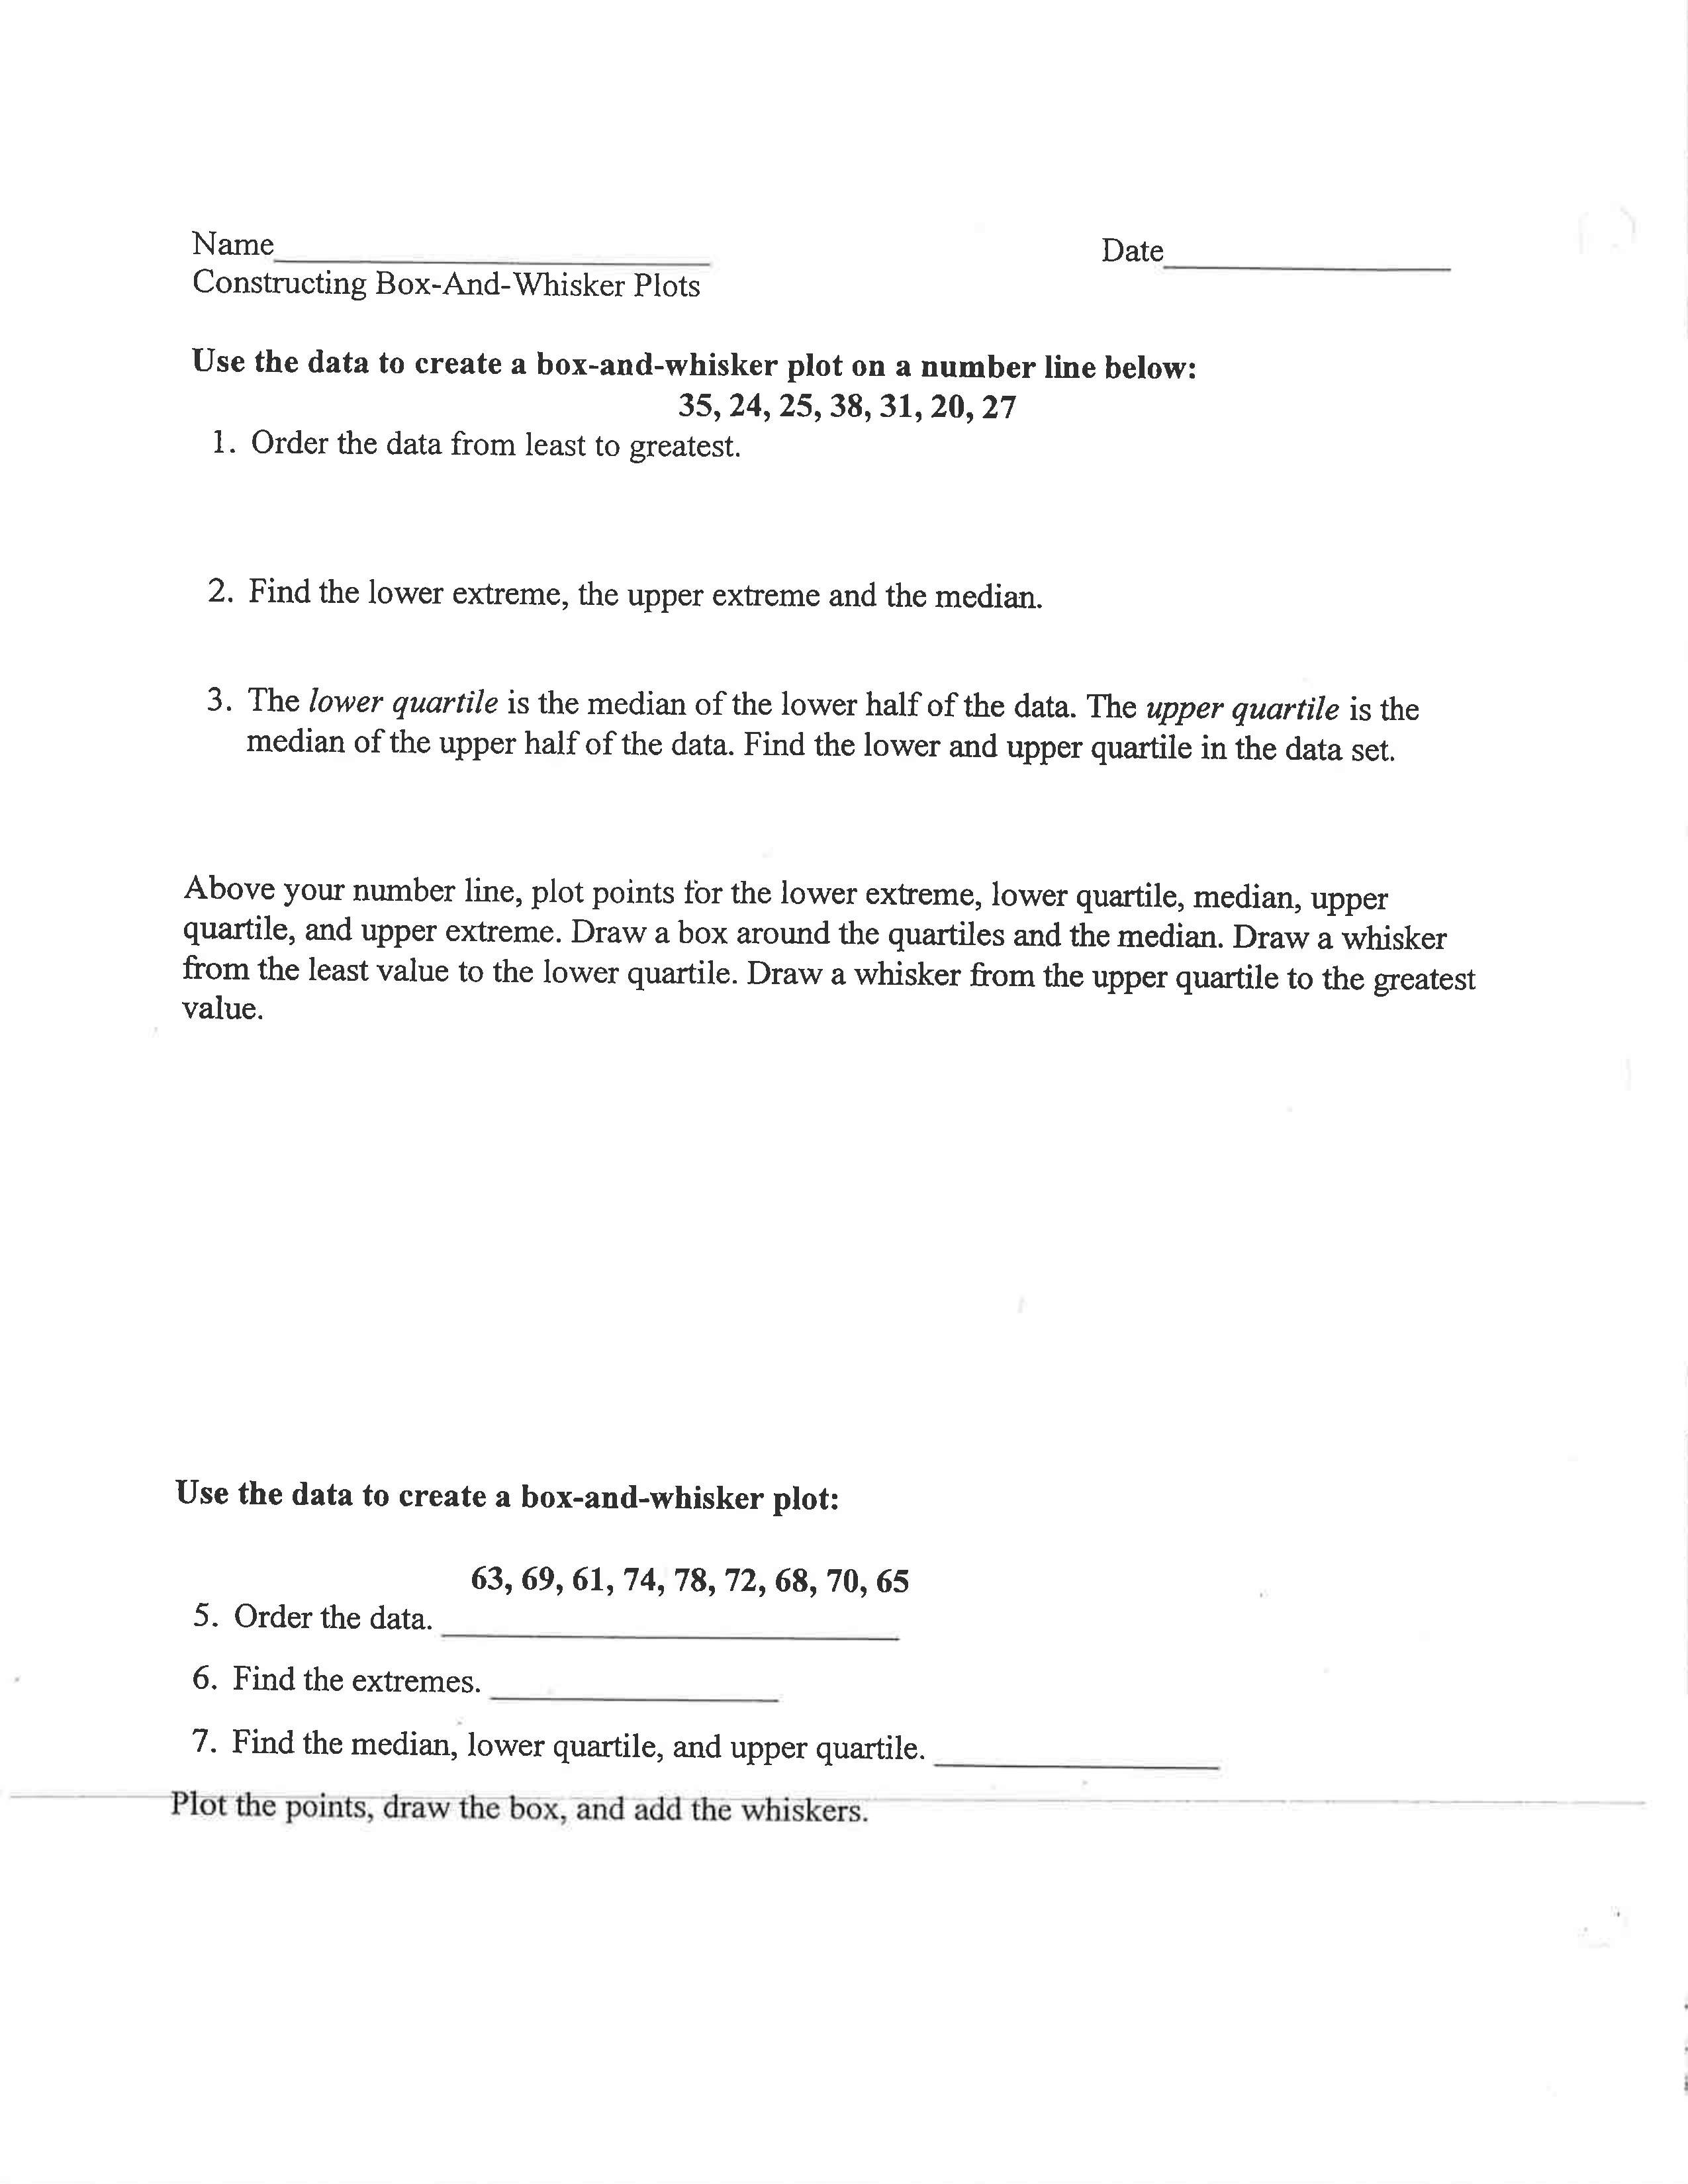
List the five number summary for this data set. Then, use the line and add tick marks to make a box plot. Properly label all the parts of the 5-number summary.
List the five number summary for this data set. Then, use the line and add tick marks to make a box plot. Properly label all the parts of the 5-number summary.
What is the minimum number in the data set?
What is the median number in the data set?
What is the maximum number in the data set?
What is the value of Q1?
What is the value of Q3?
DESCRIBE the five number summary. Think about the 25/25/25/25 that was discovered during the Desmos activity.
Select the values for minimum, median and maximum.
Select the values for quartile 1, Q1, and quartile 3, Q3.
DESCRIBE the interquartile range (IQR). 1. How much of the data is there? 2. What are the boundaries? 3. How do you find it? 4. What is the IQR for this data set?