Day 9 Summary Statistics Practice
star
star
star
star
star
Last updated about 5 years ago
22 Nsɛmmisa
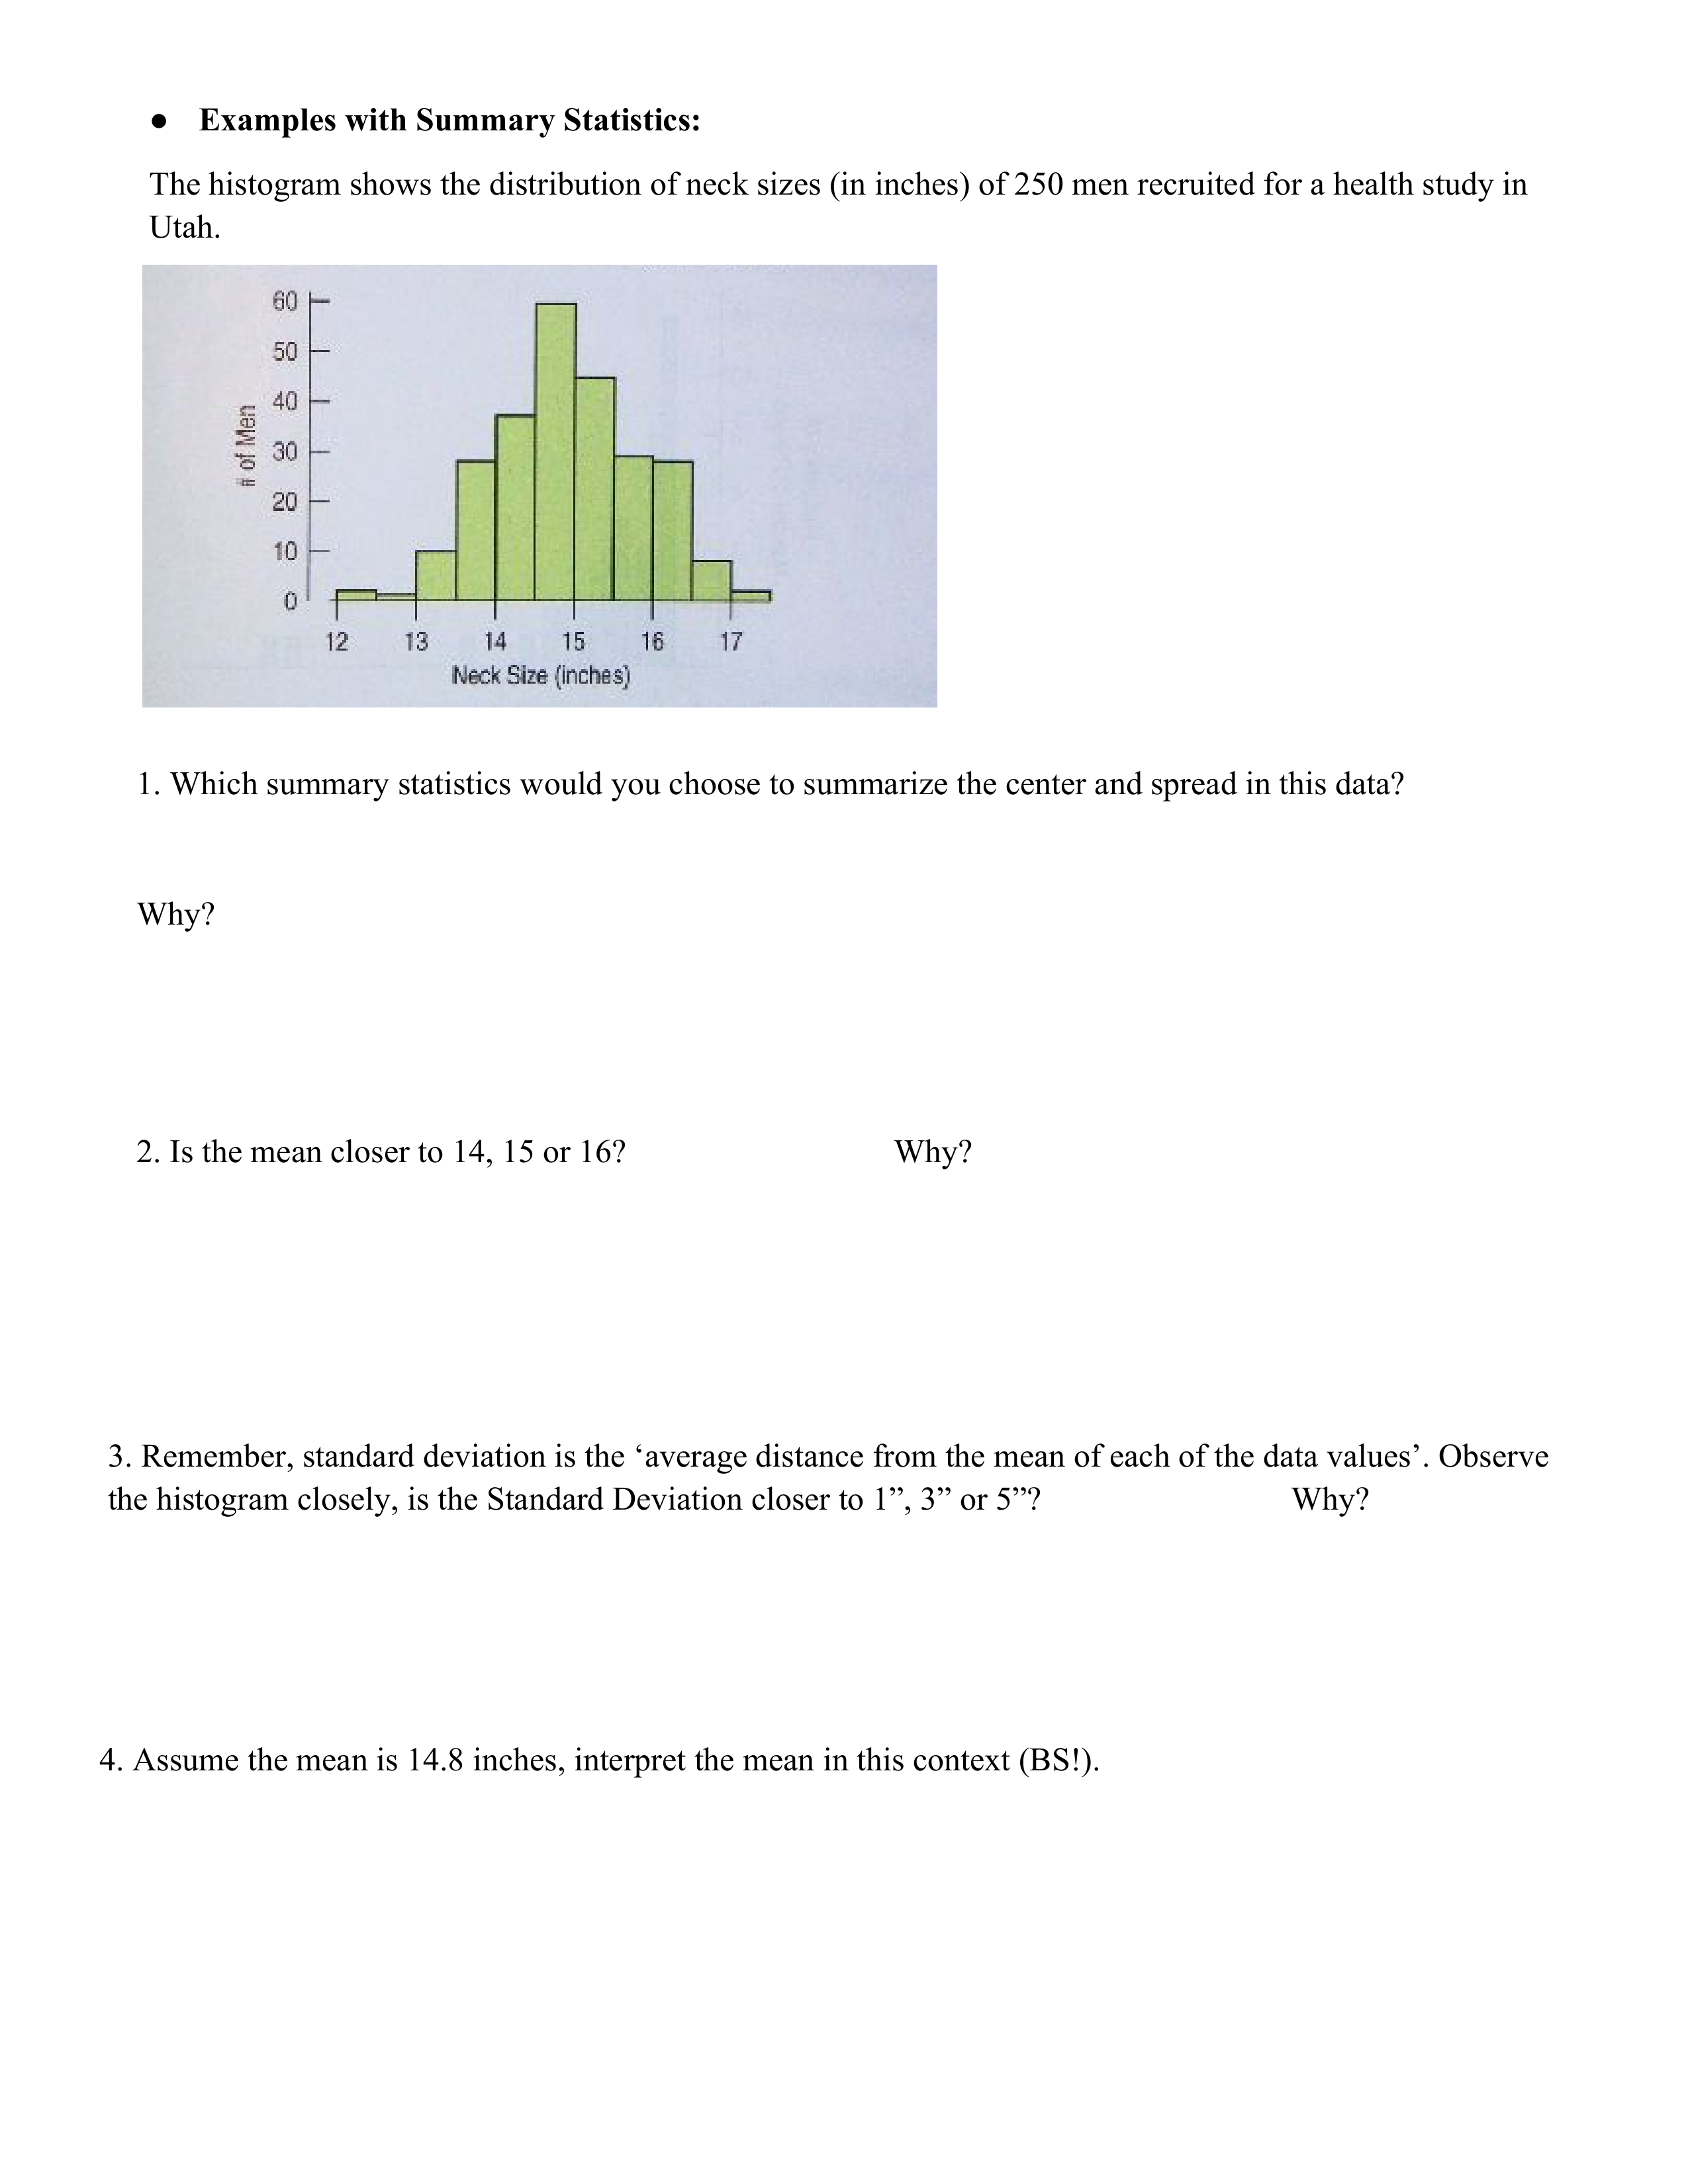
Which summary statistics would you choose to summarize the center and spread in this data?
Explain.
Is the mean closer to 14, 15 or 16? Explain.
Is the Standard Deviation closer to 1", 3" or 5"?
Explain.
Interpret the mean in context.

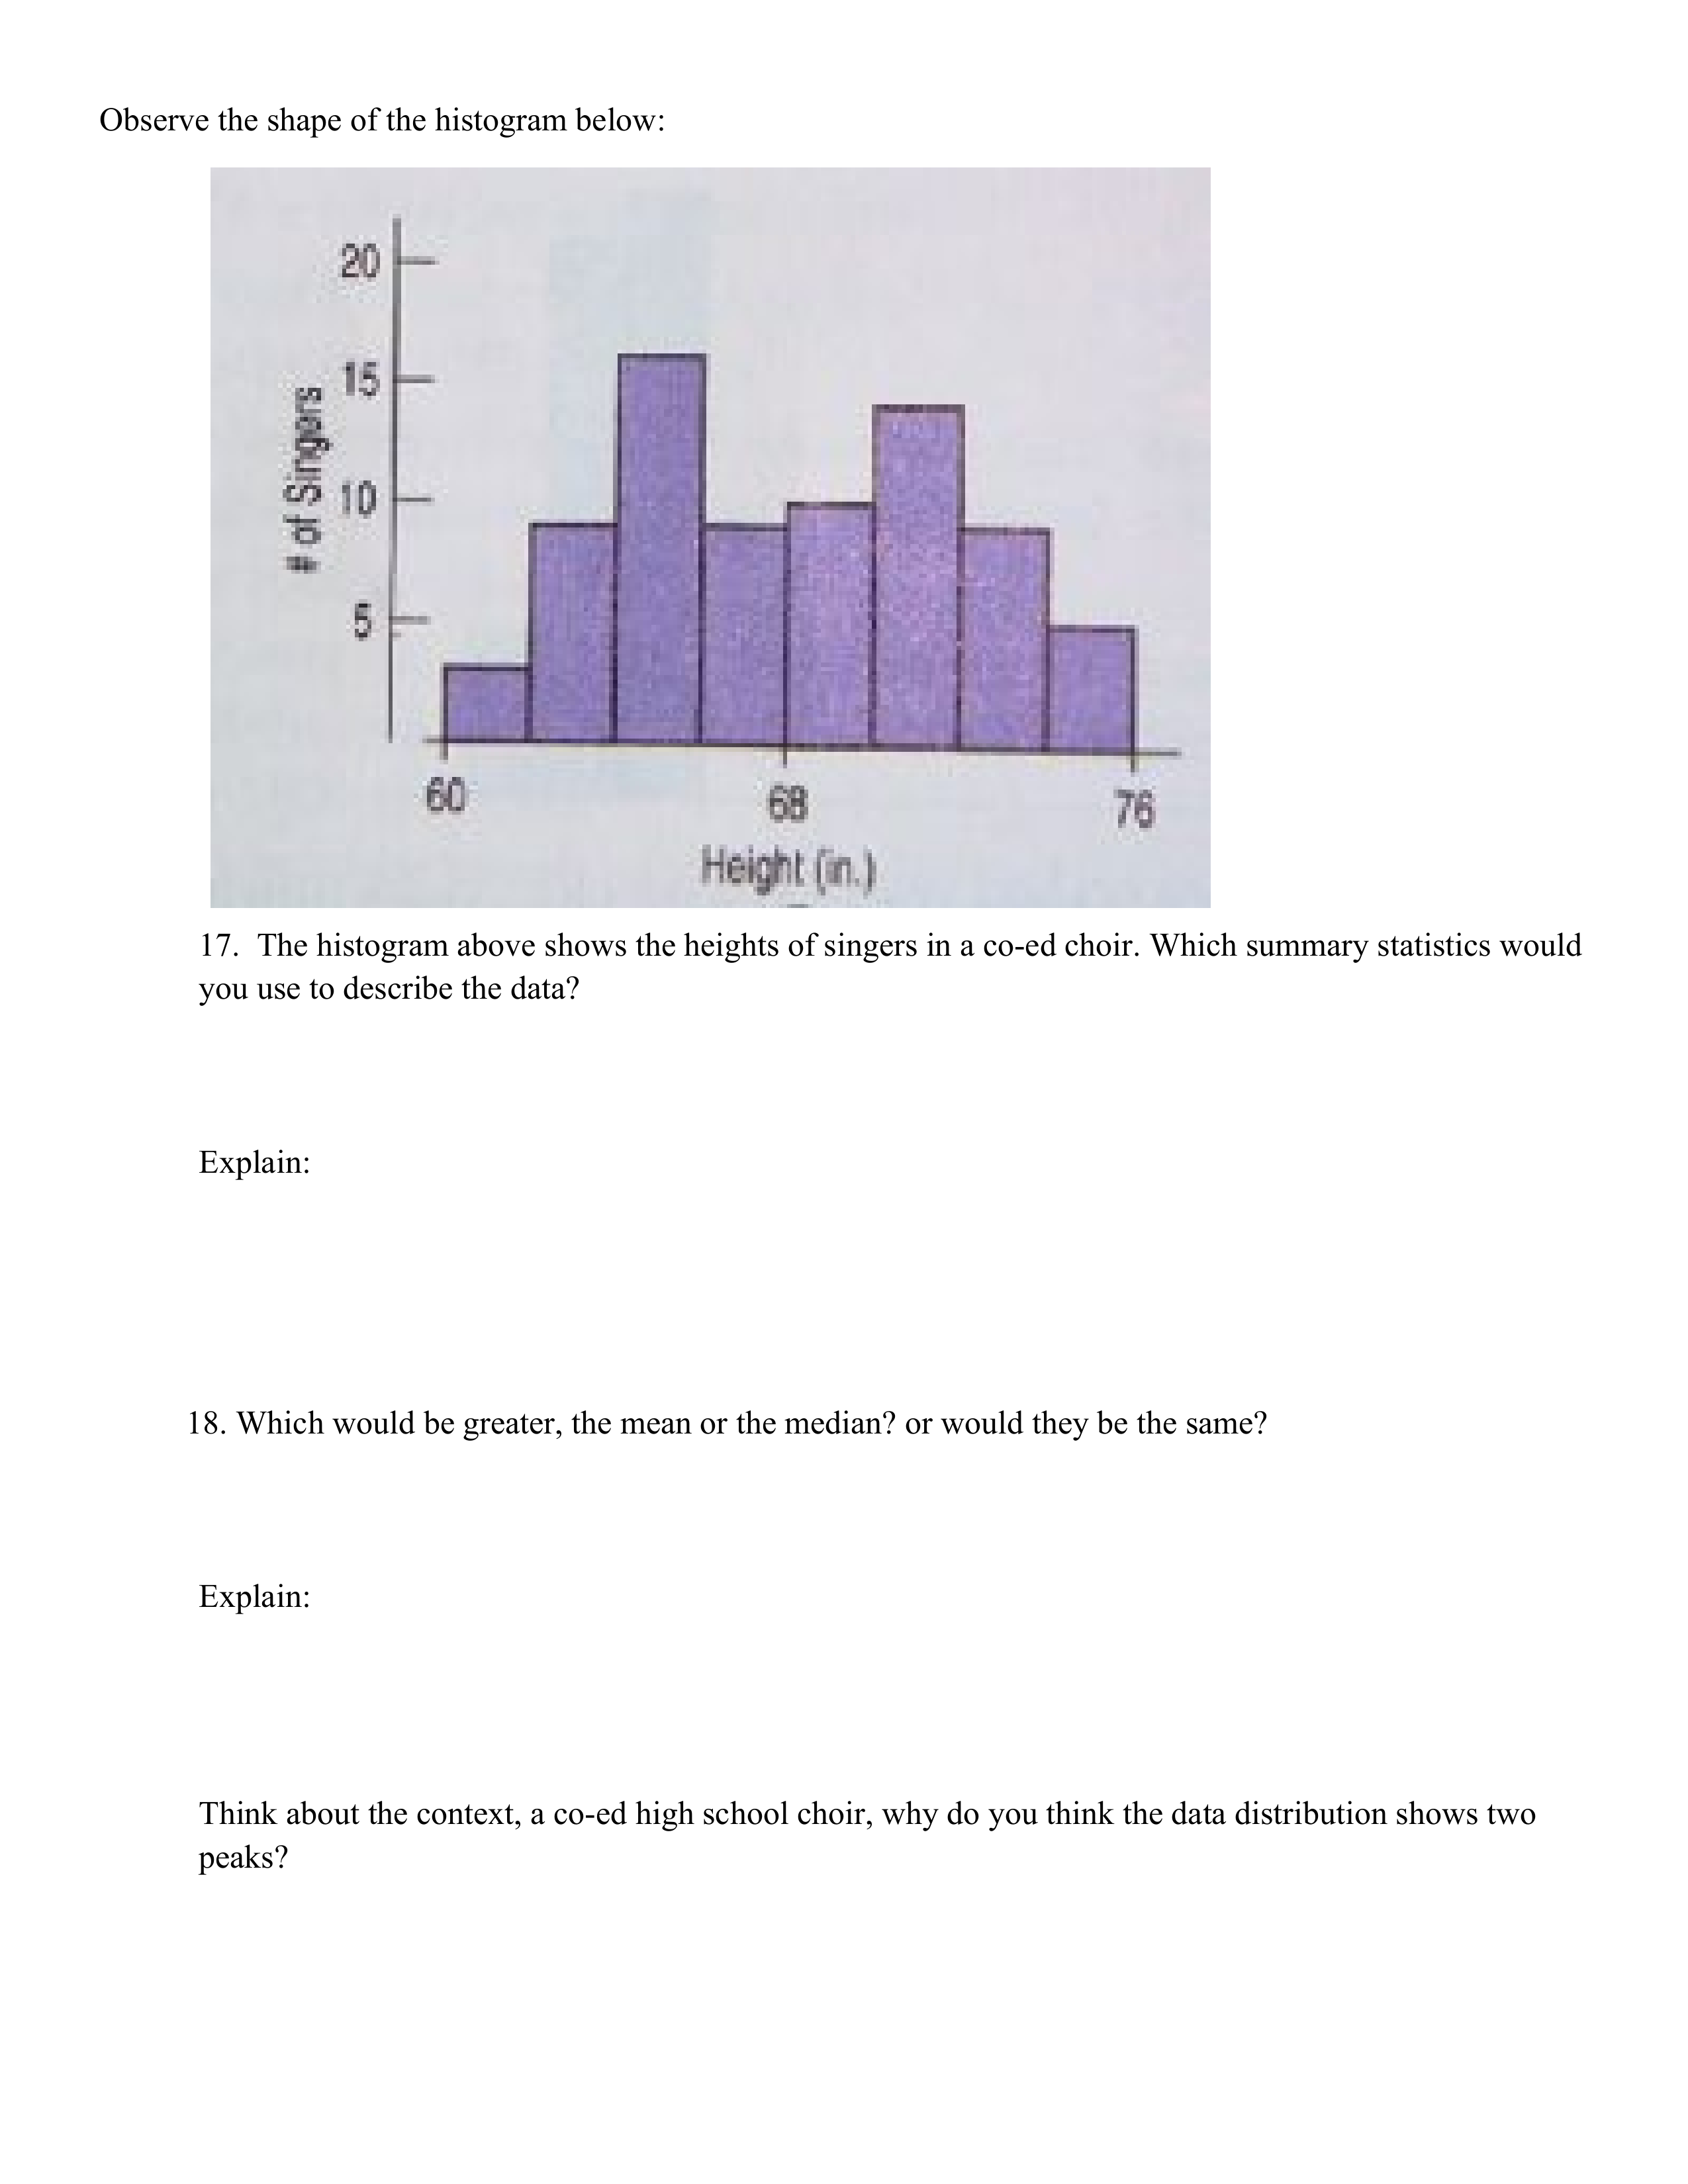
CUSS & BS about the histogram.
Would you expect the mean or the median to be higher? Why?
Which summary statistics would be used to describe the center and spread of the data distribution? Why?
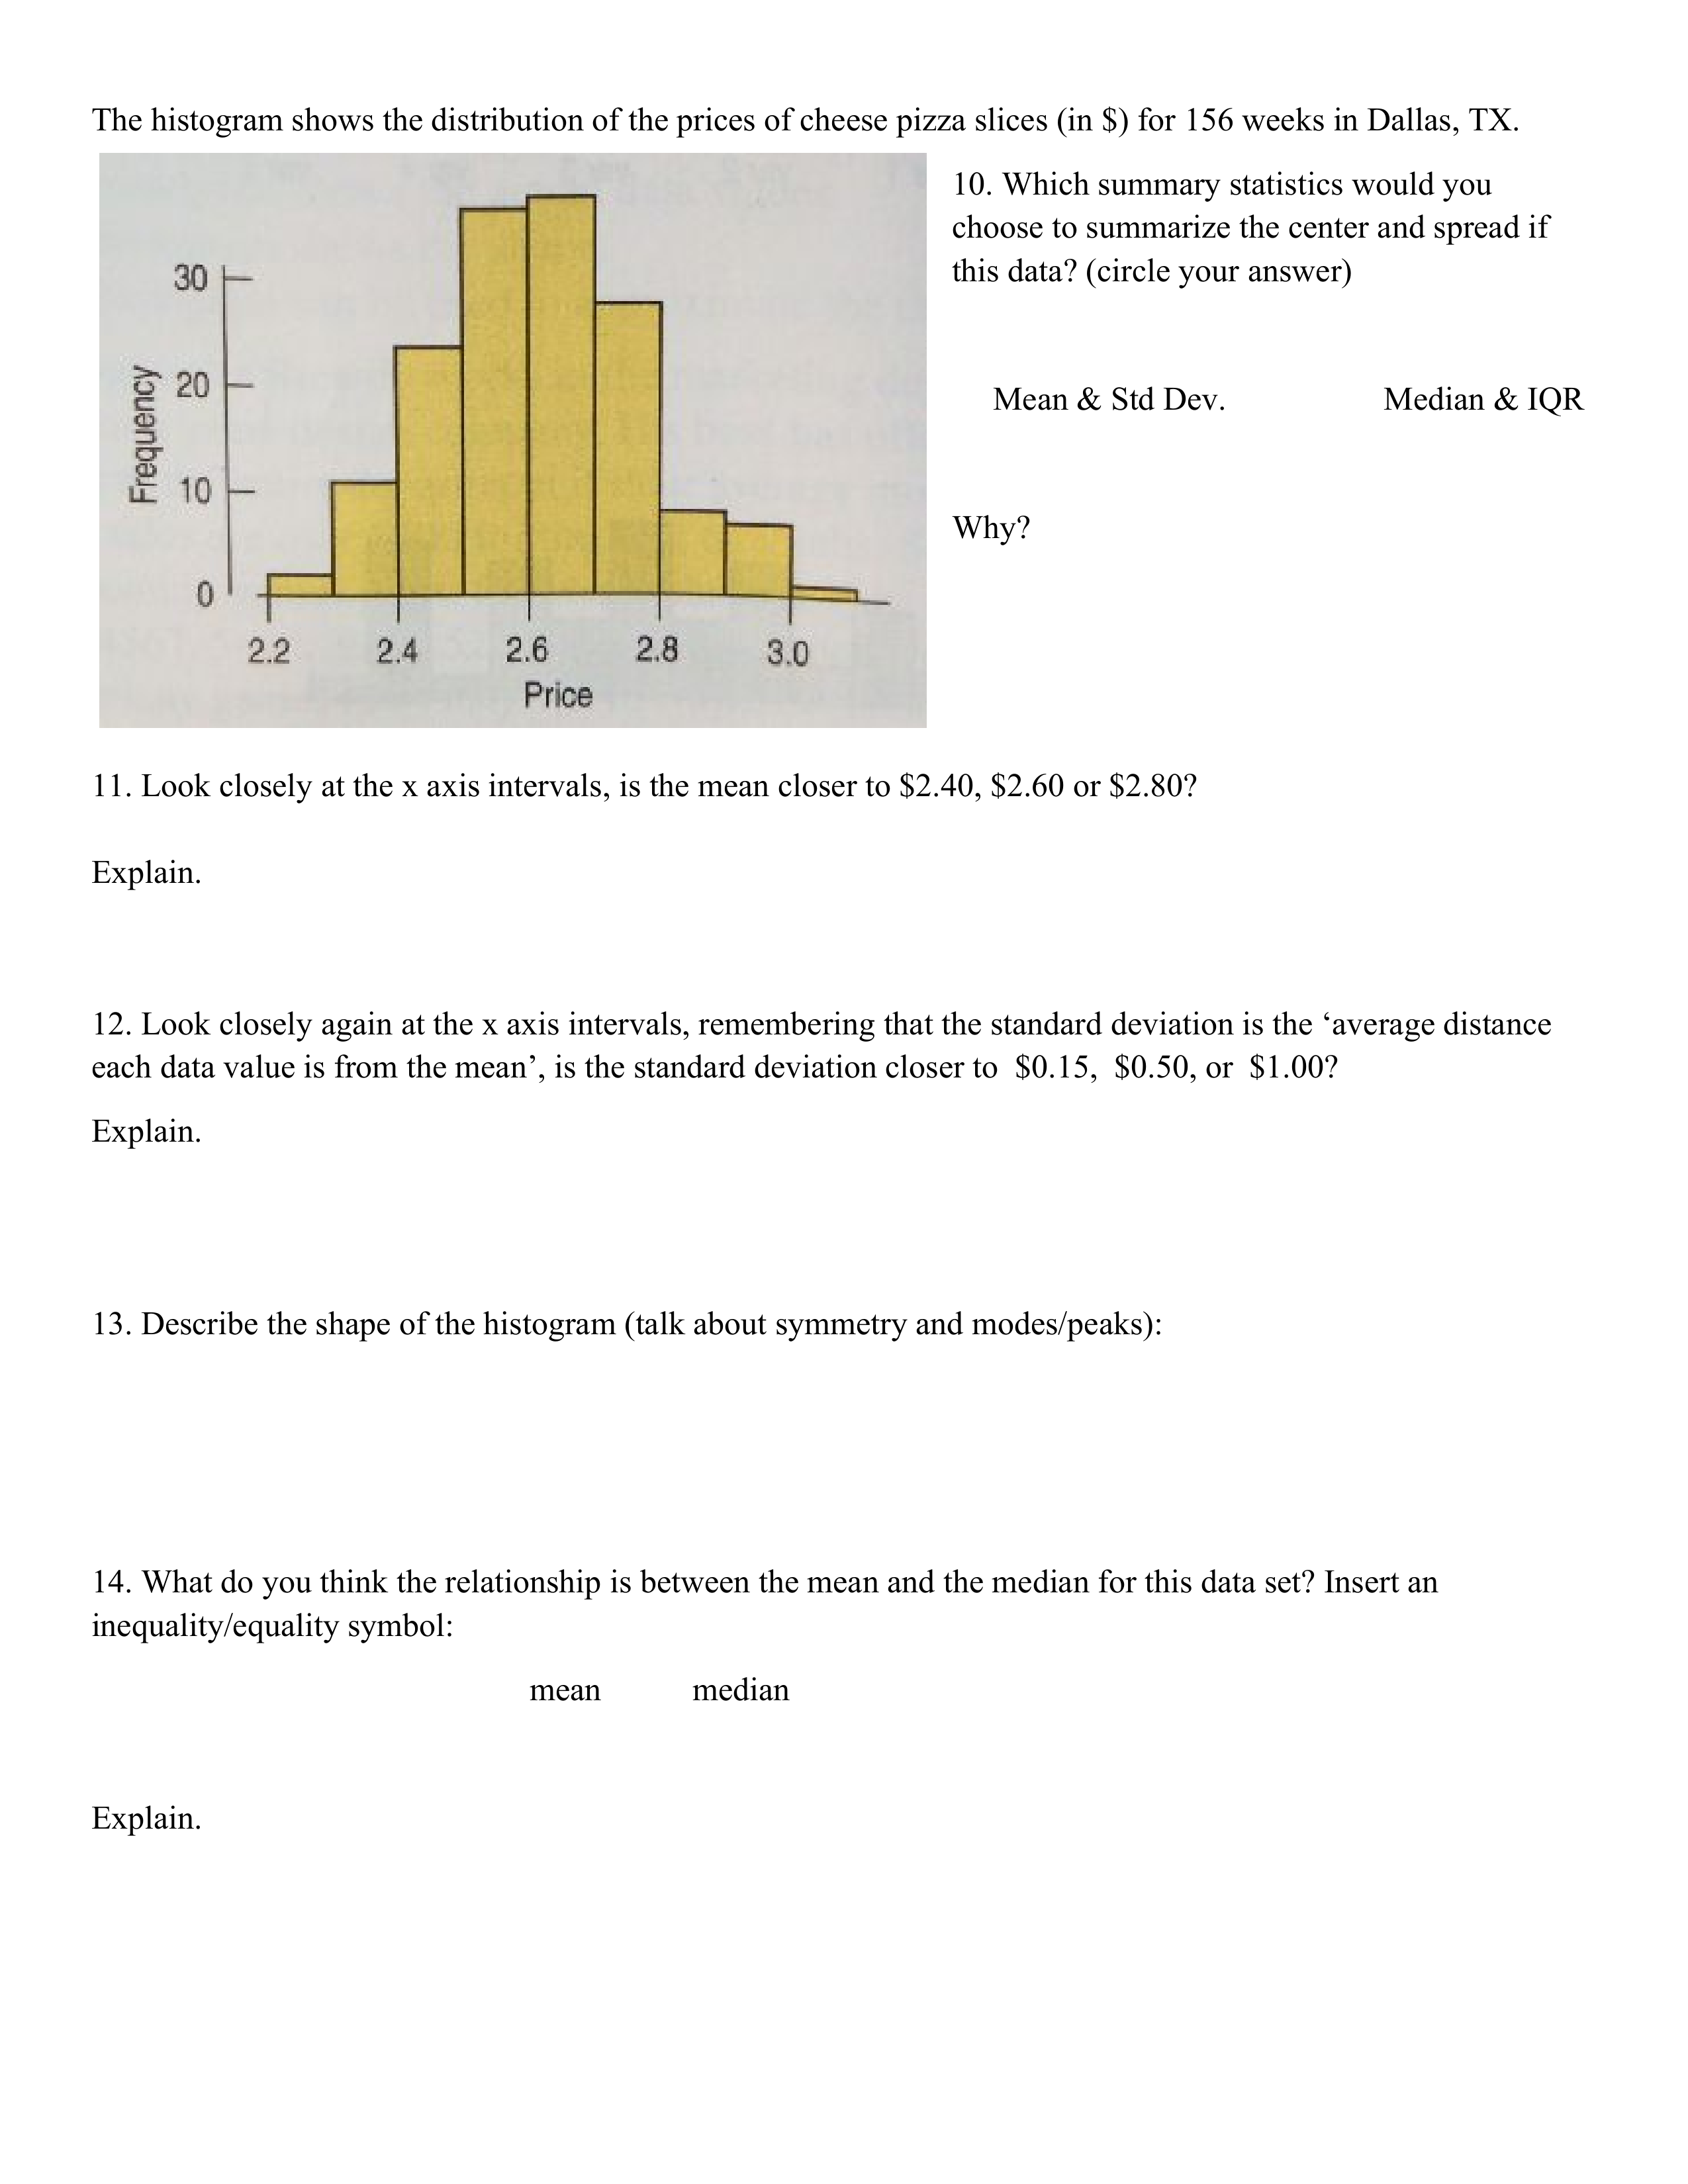
Which summary statistics would you use to describe the data distribution? Why?
Is the mean closer to $2.40, $2.60 or $2.80? Explain.
Is the standard deviaton closer to $0.15, $0.50 or $1.00? Explain.
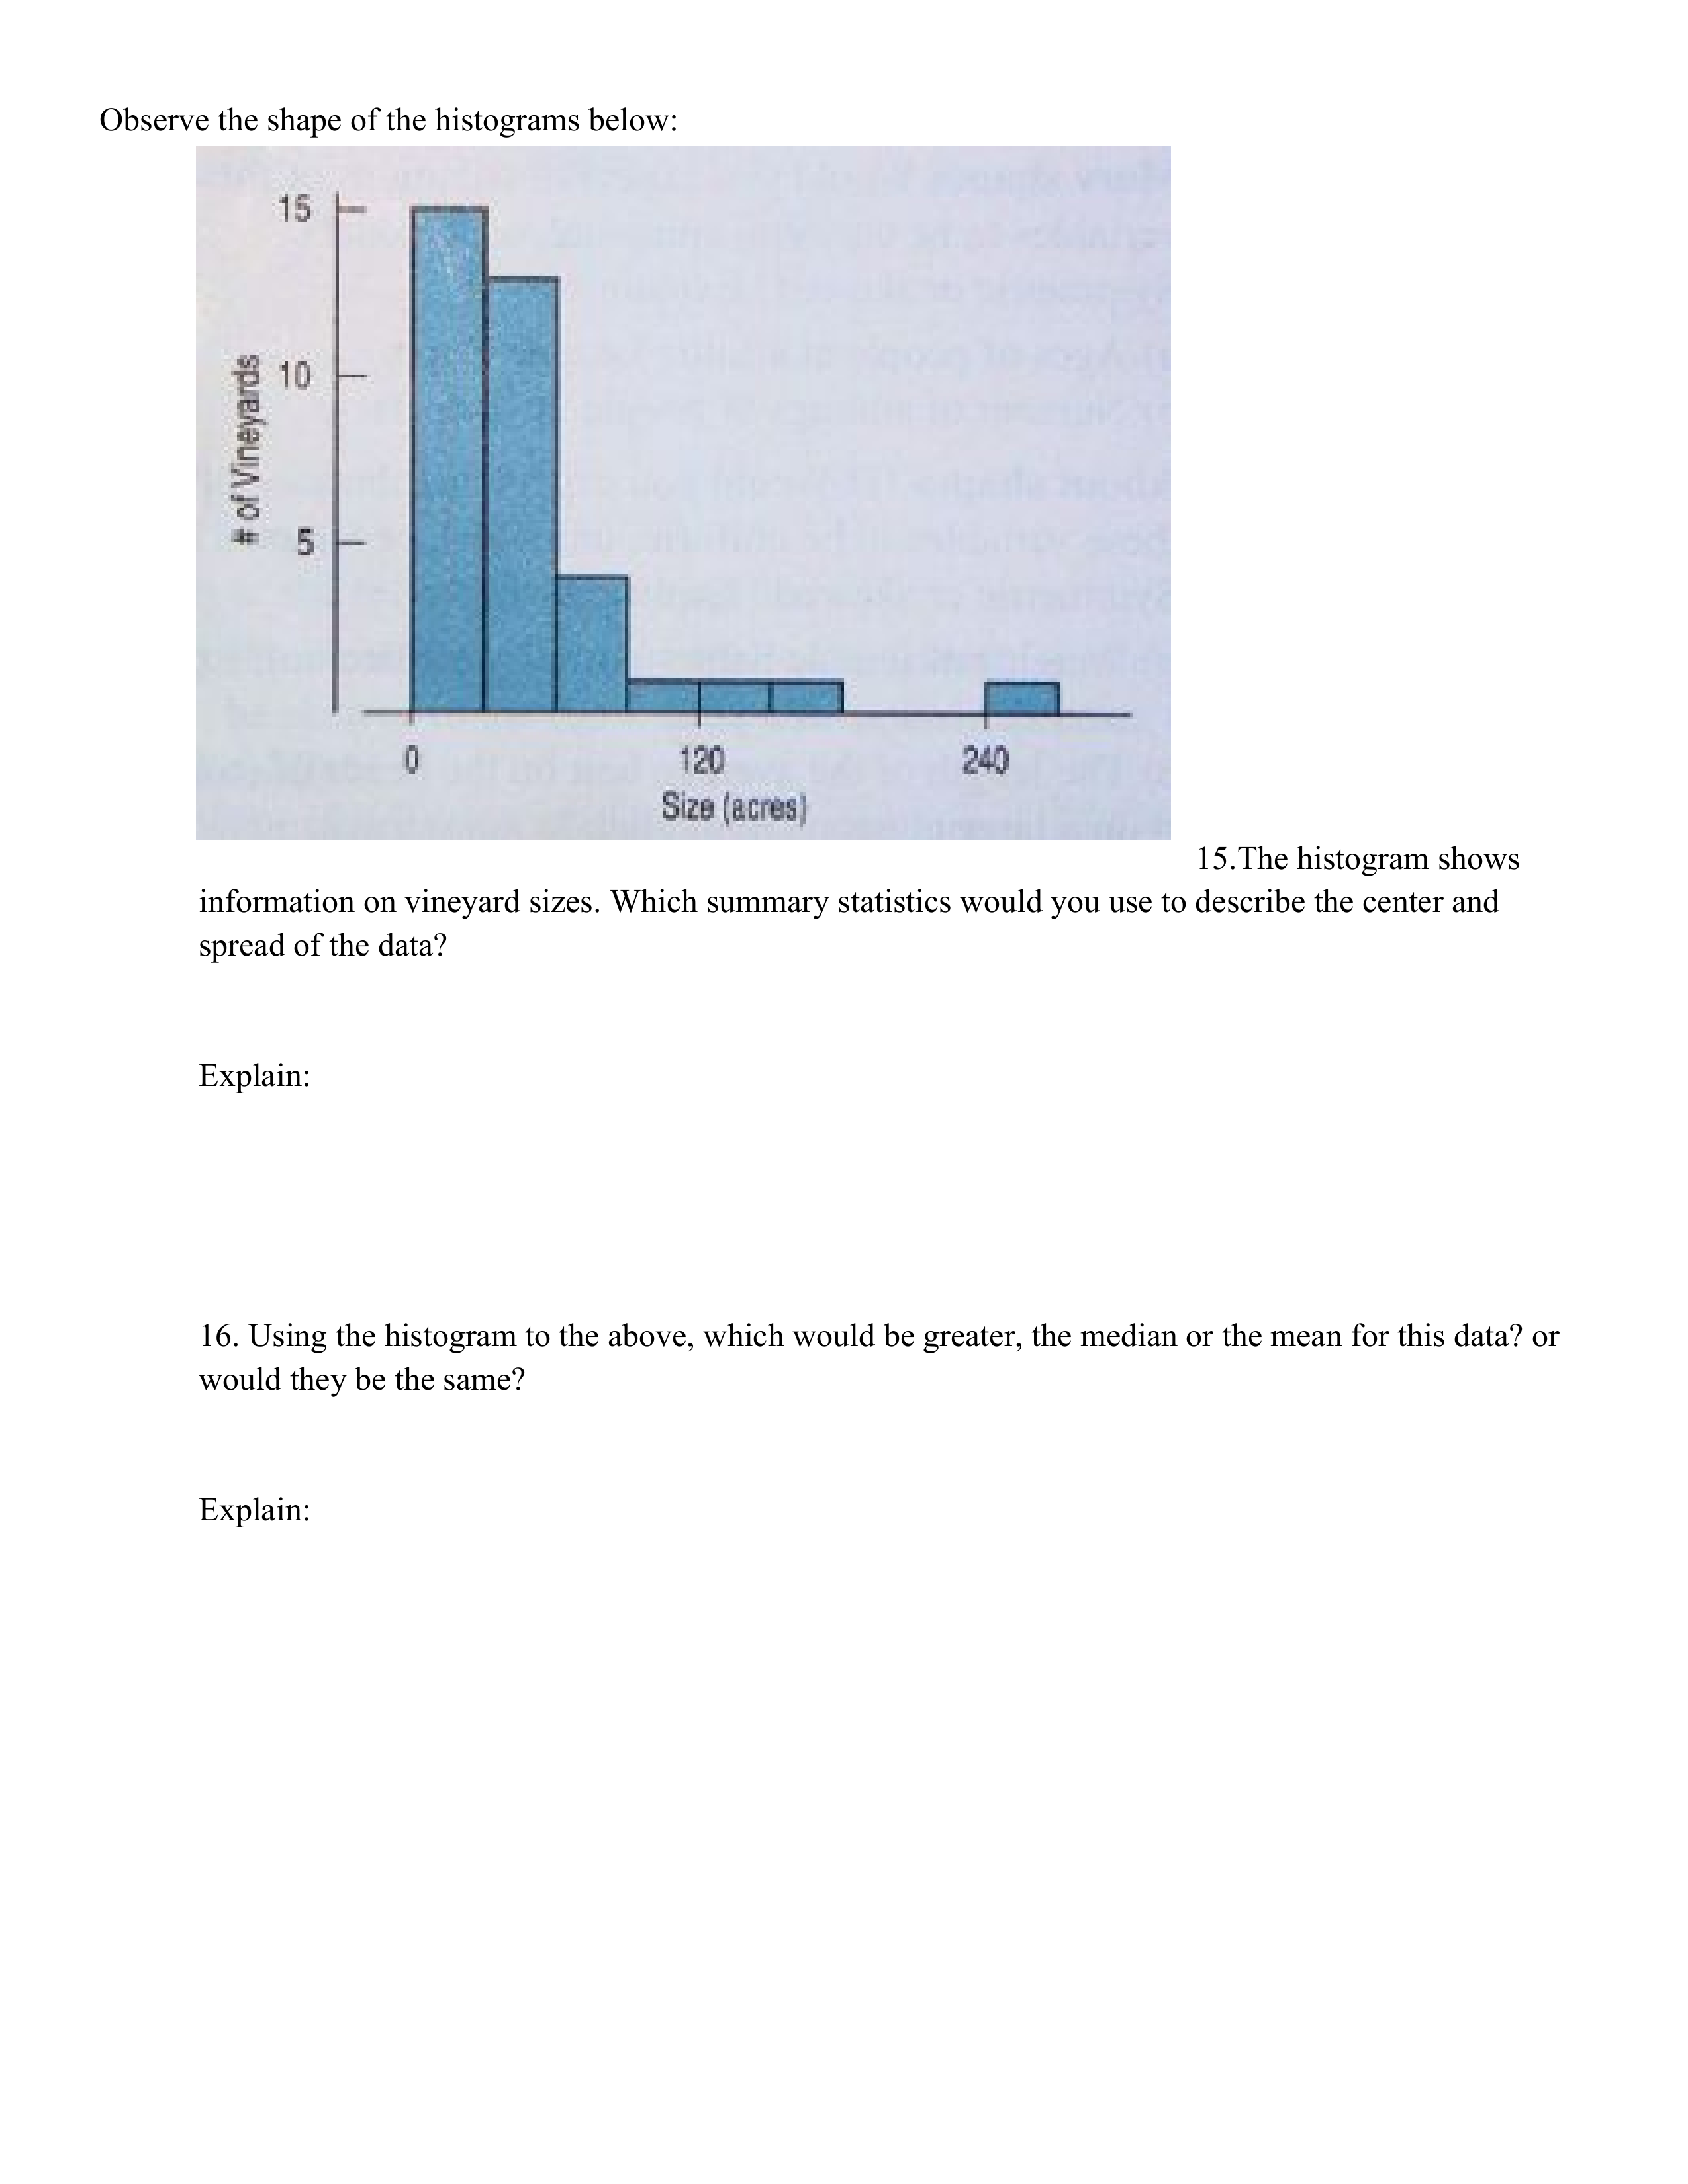
Which summary statistics would you use to describe the data distribution?
Which would be greater, the mean or the median of the data? Explain.
Which summary statistics would you use to describe this data distribution? Explain.
Which would be greater, the mean or median? Or would they be the same? Explain.
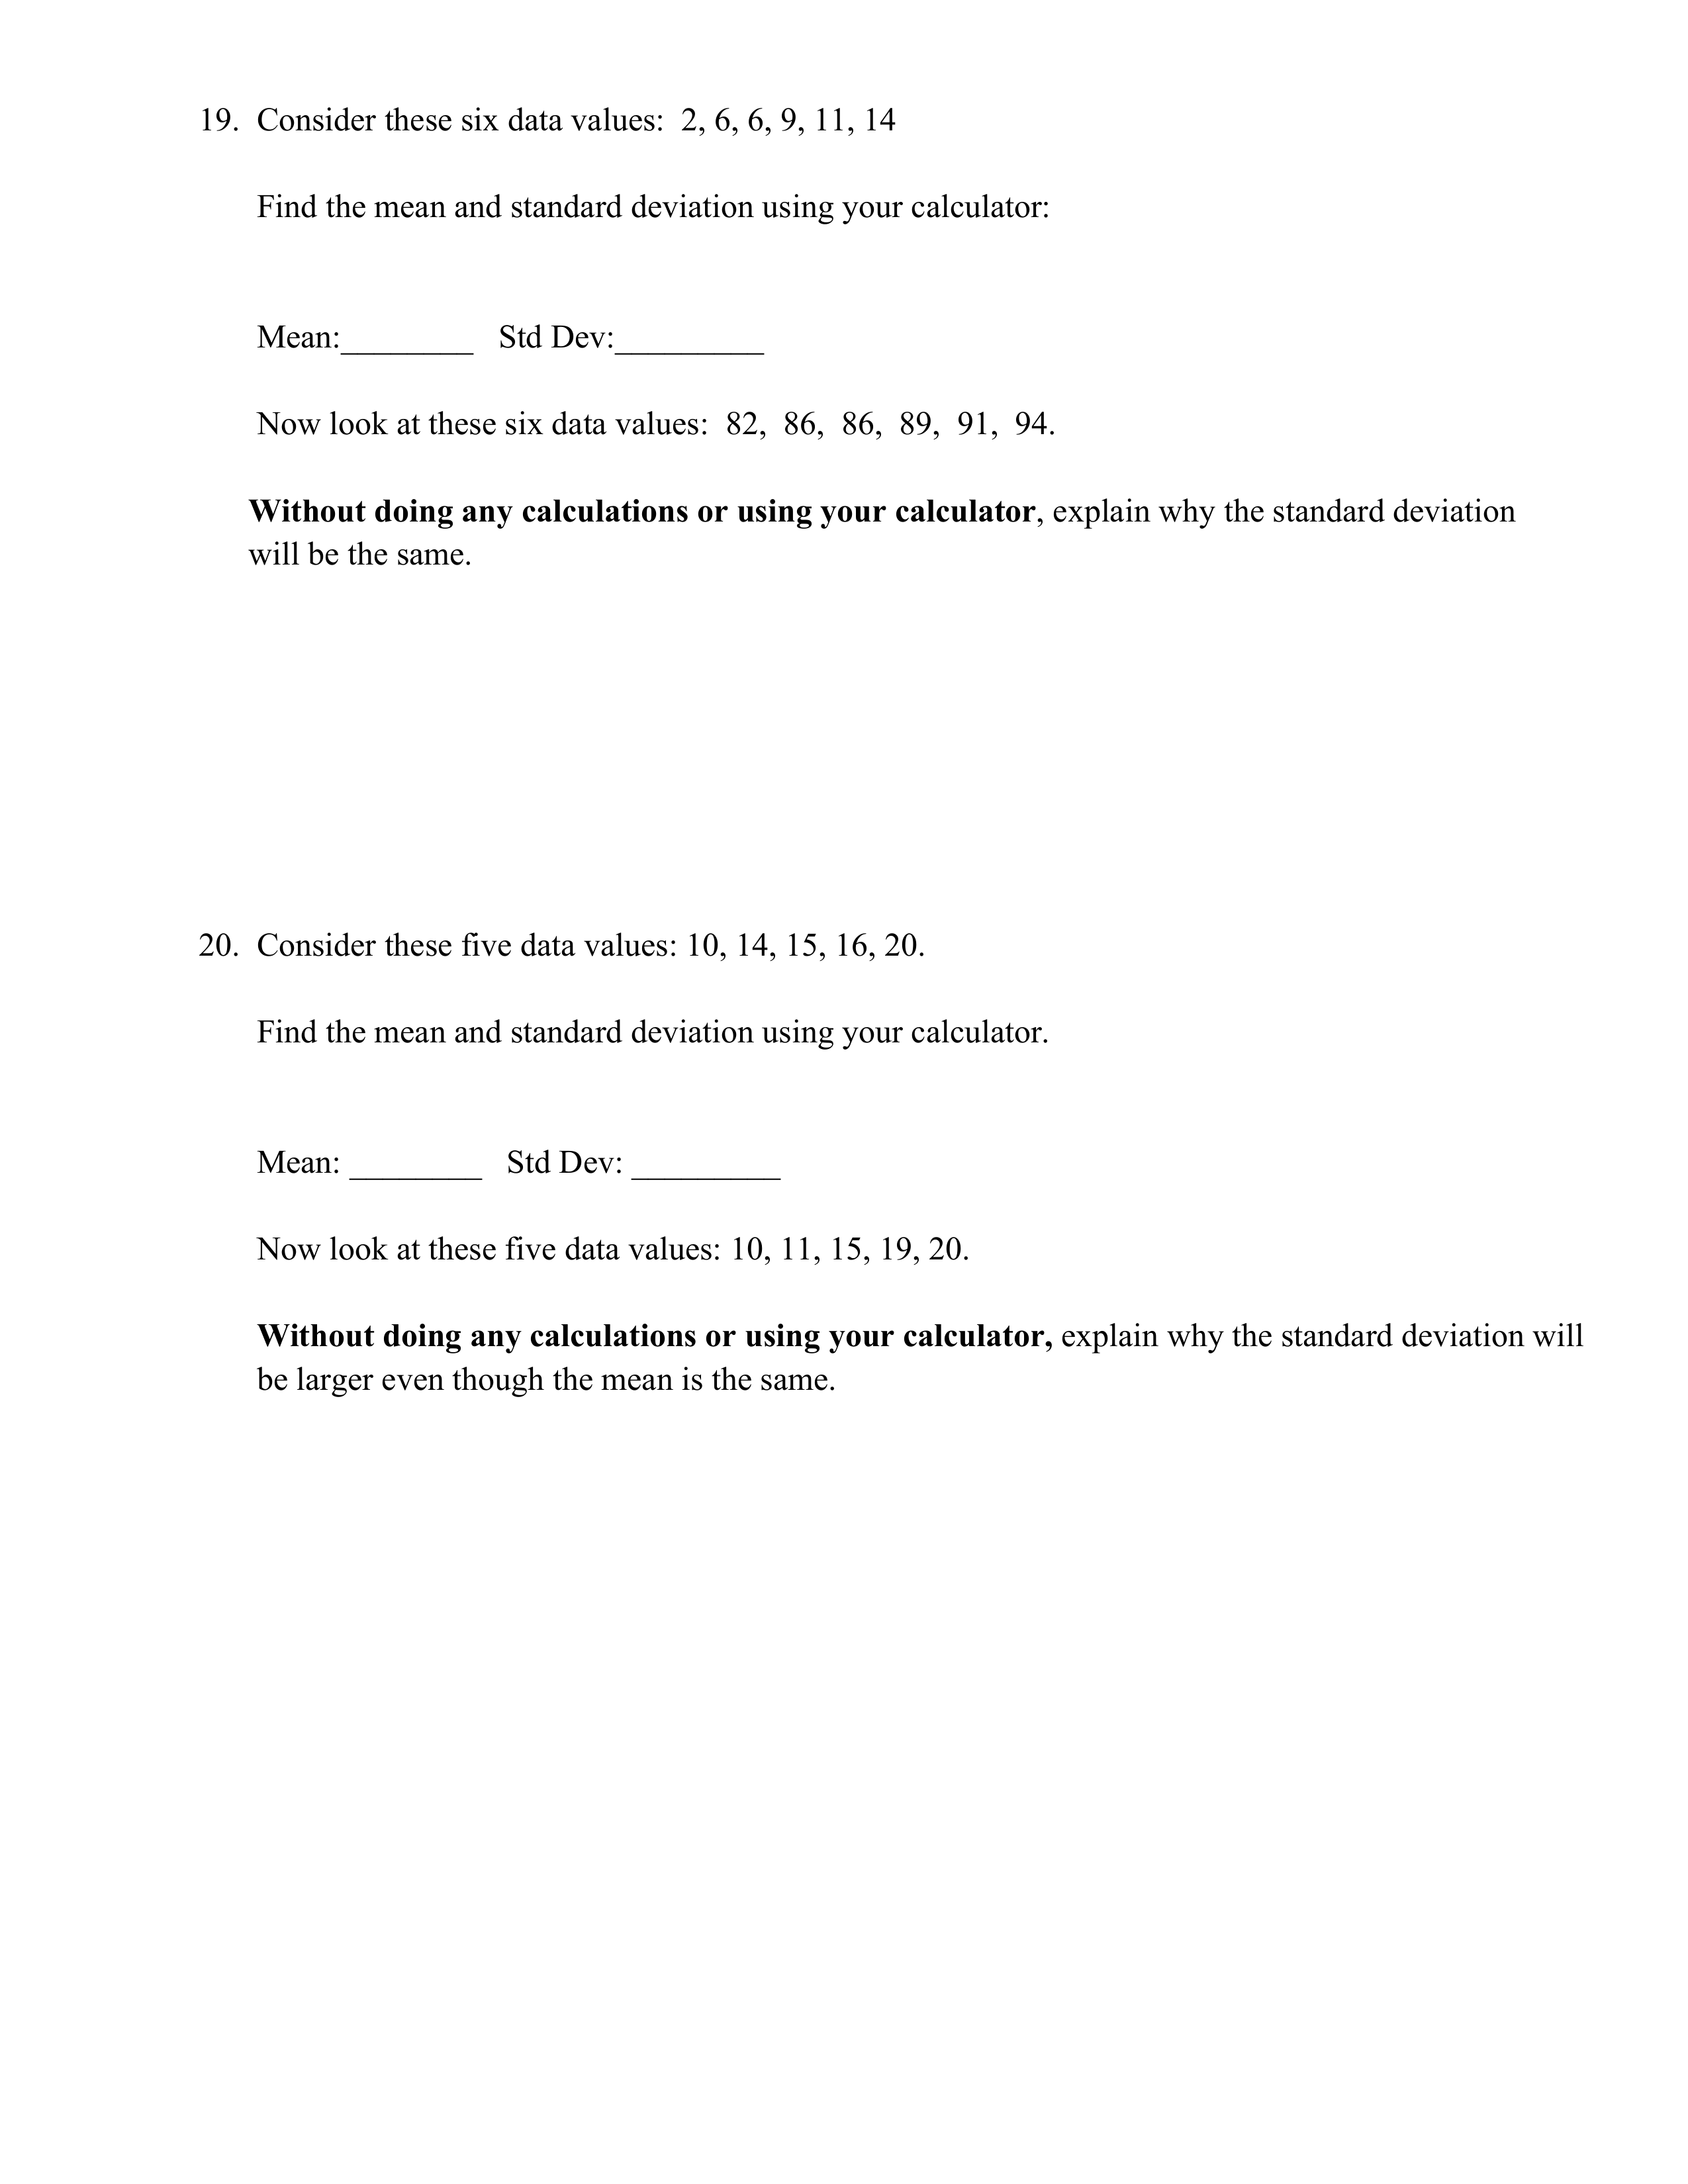
Calculate the mean and Std Dev (to three places past the decimal) of the first list of numbers.
Why will the standard deviation remain the same between the two lists?
Find the mean and Std Dev (round the Std Dev to three places past the decimal) of the first list of numbers.
Why will the standard deviation be larger for the second list of numbers?
Is the standard deviation closer to 2 min, 5 min or 8 min? Why?
What could explain the skew in the data shown by the histogram? Use context.
Describe the shape of the histogram:
What is the relationship between the mean and the median?
Use the keyboard to insert the inequality symbol.