1
1
1
1
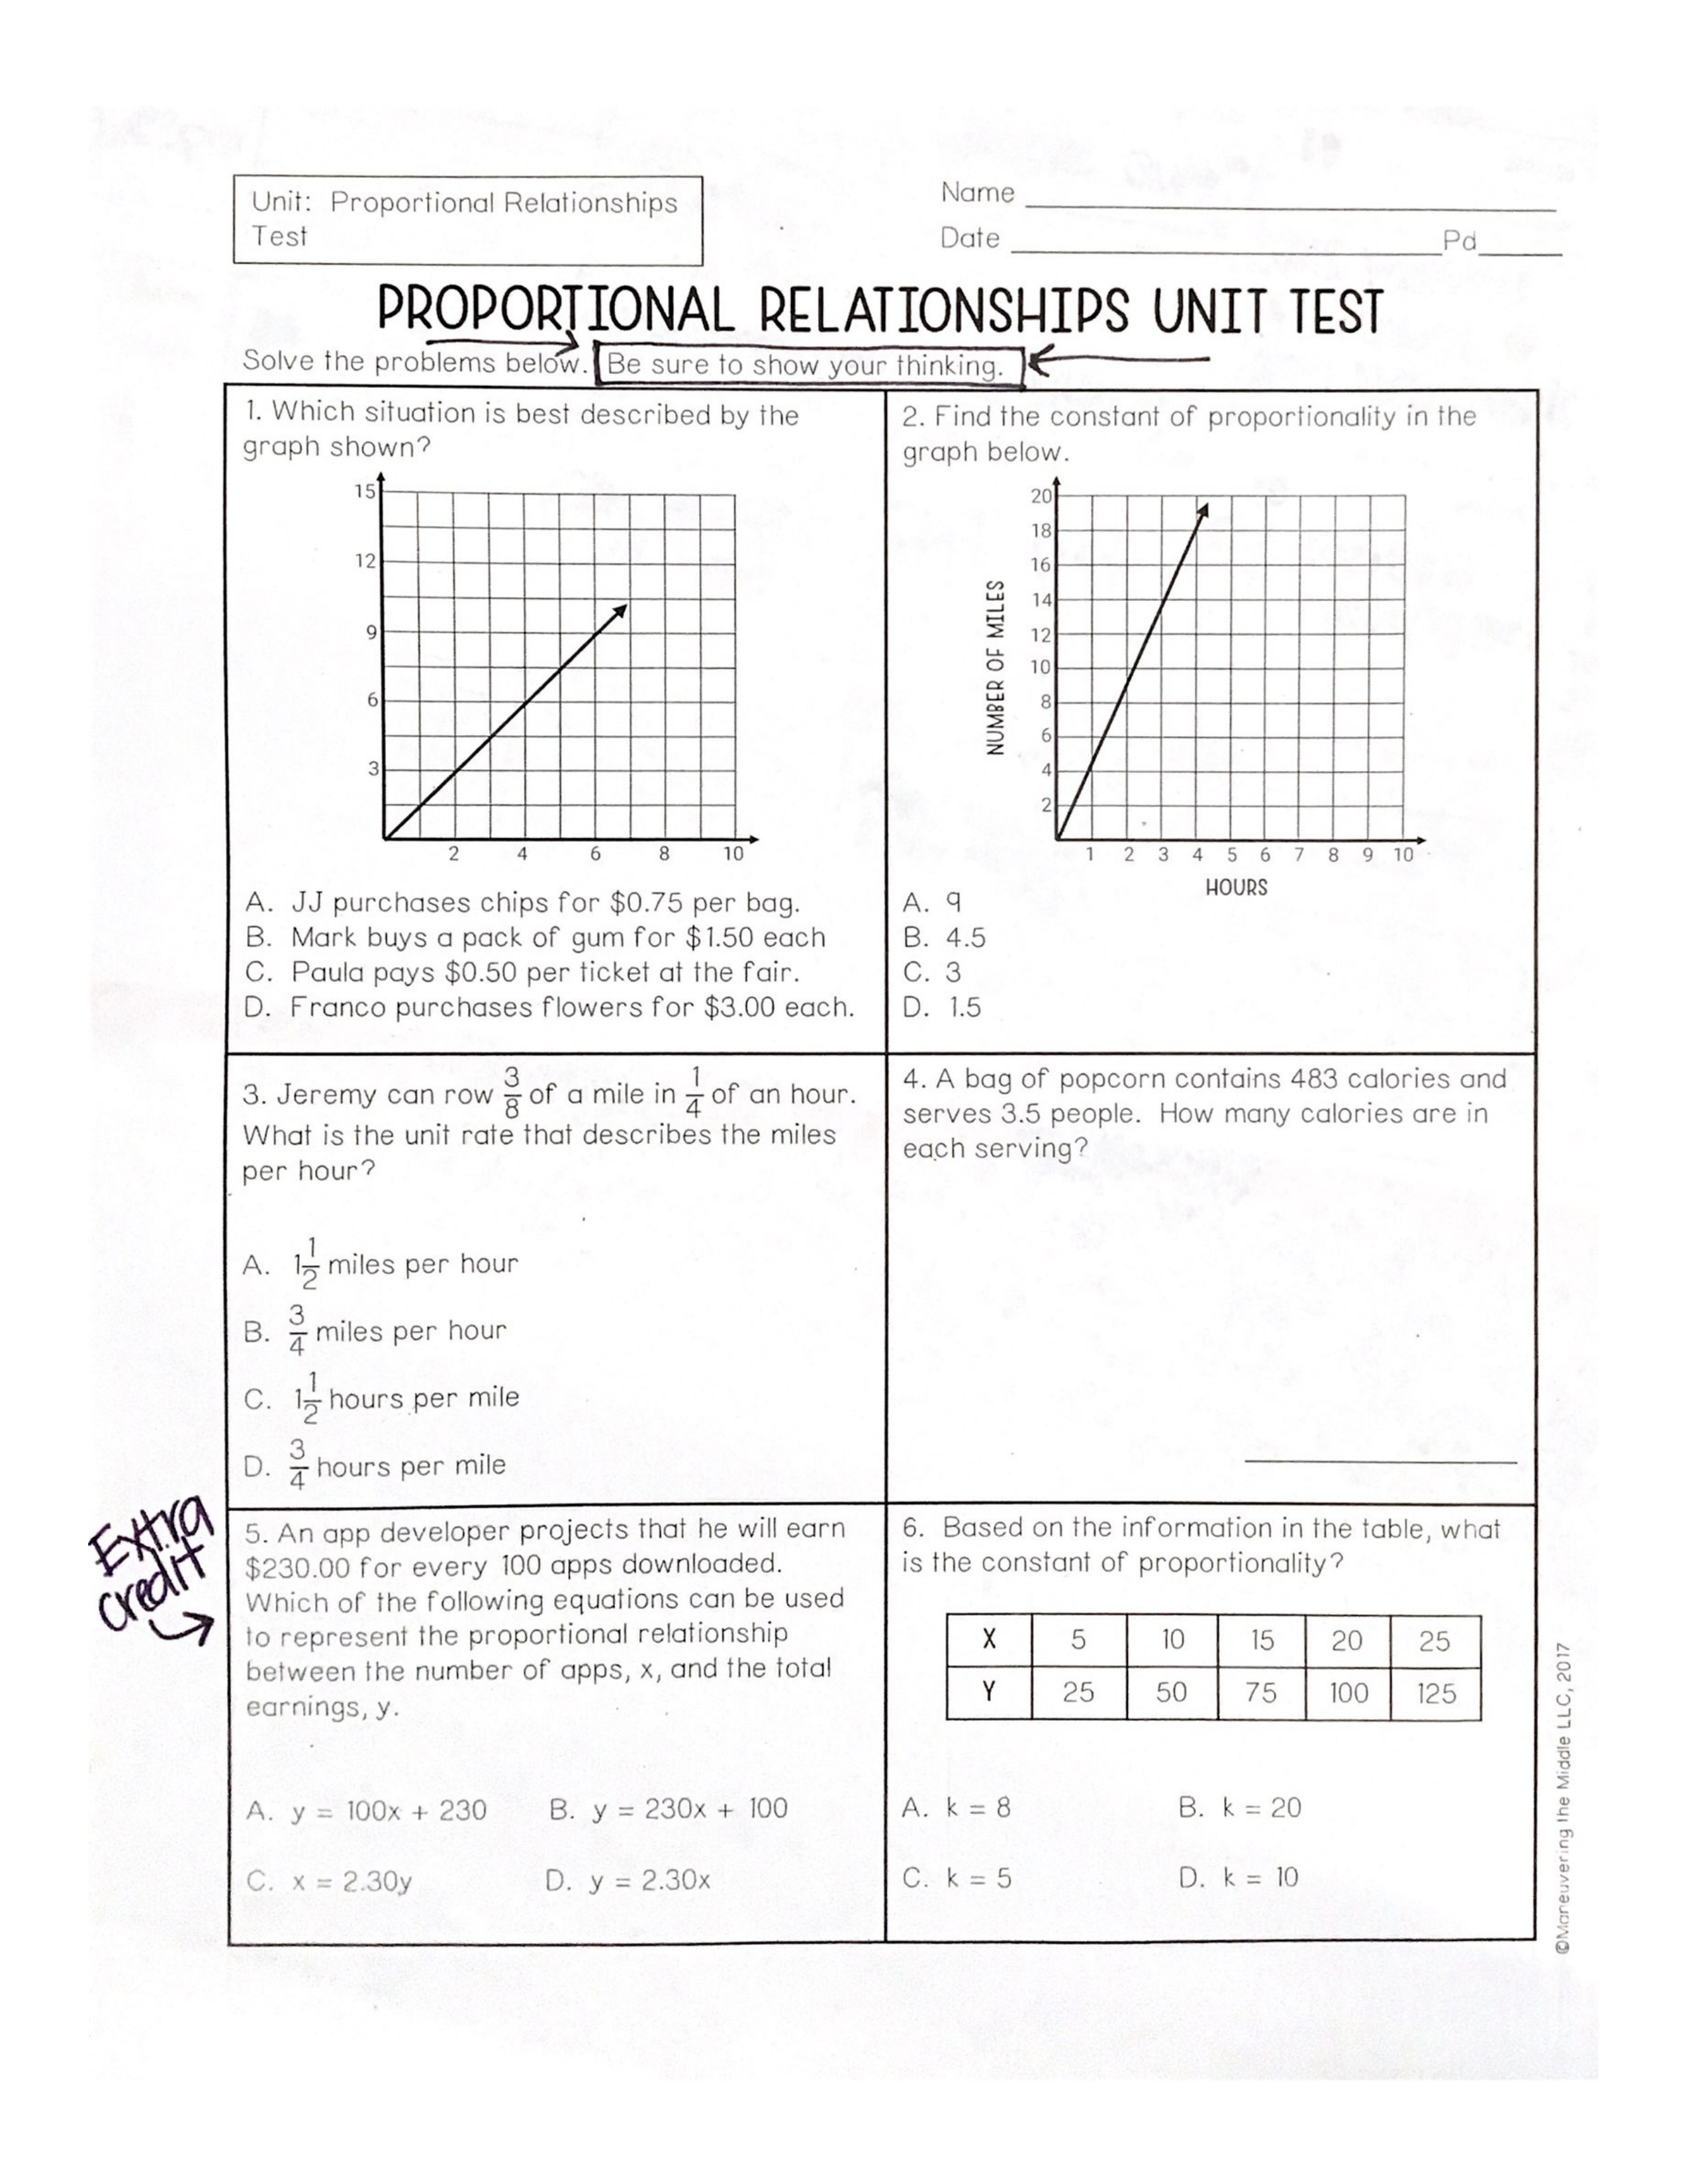
A bag of popcorn contains 483 calories and serves 3.5 people. How many calories are in each serving?
A bag of popcorn contains 483 calories and serves 3.5 people. How many calories are in each serving?
1
A bag of popcorn contains 483 calories and serves 3.5 people. How many calories are in each serving?
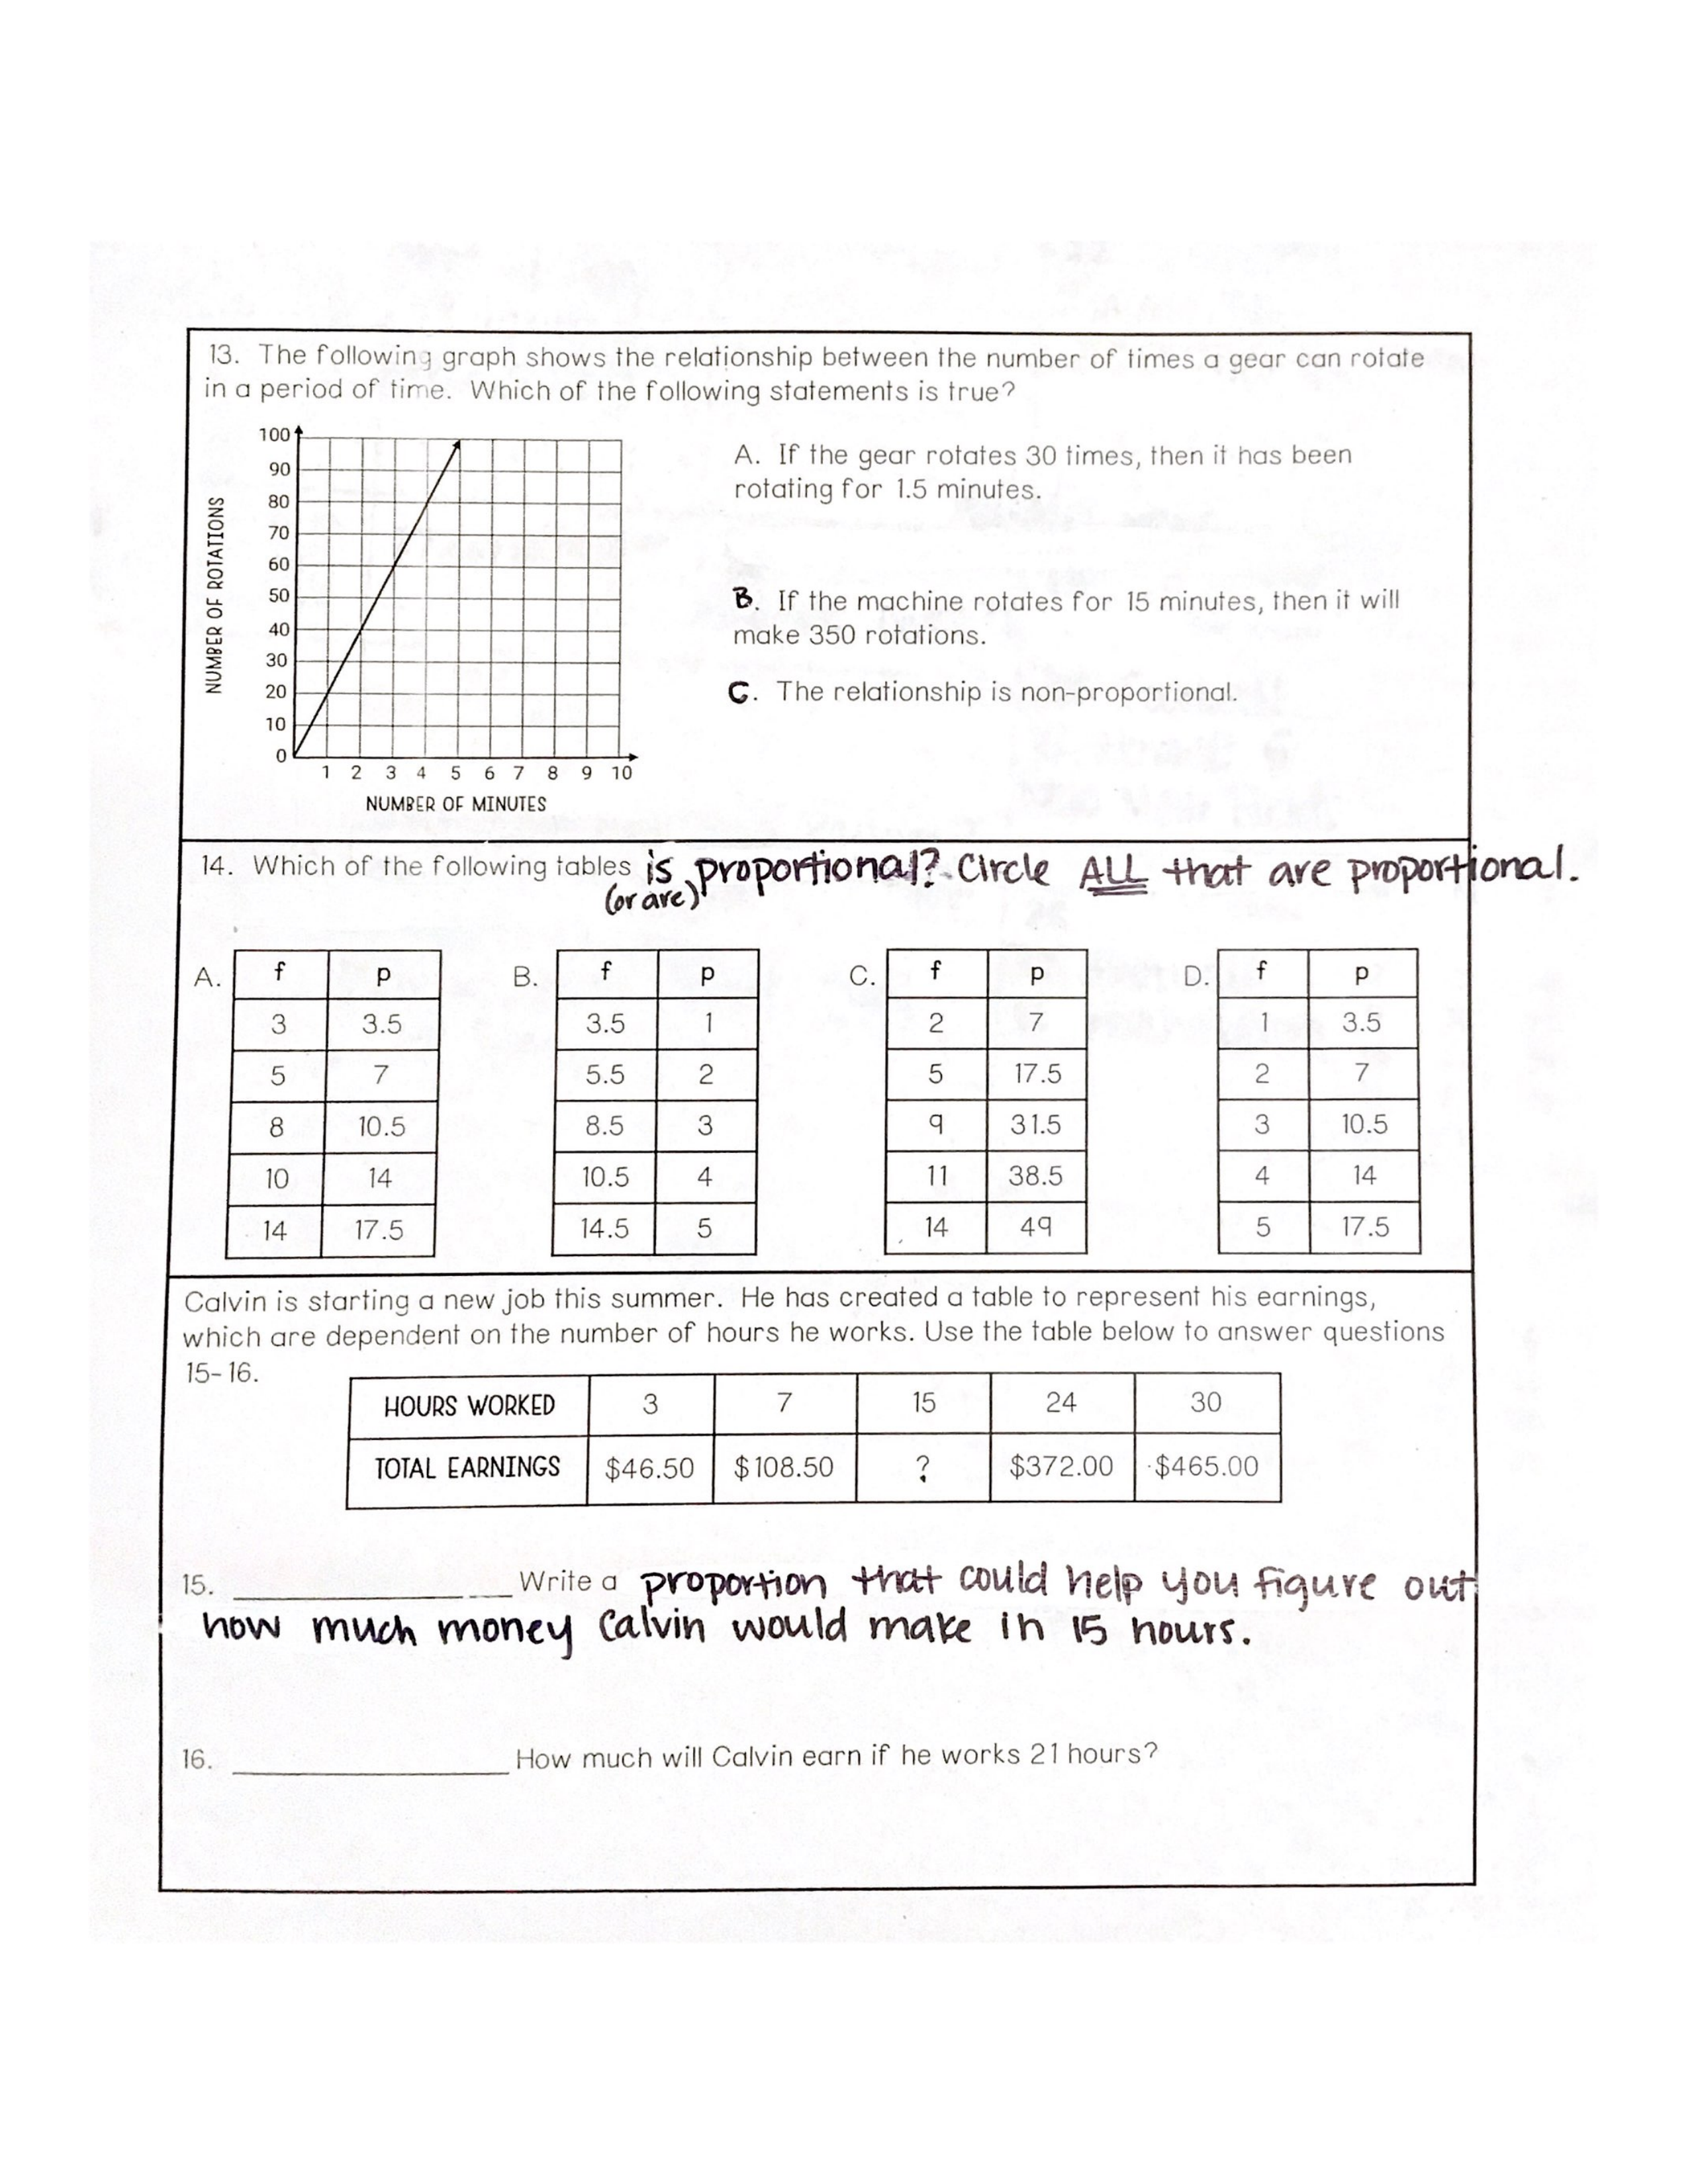
#13 - Which statement is TRUE based on teh graph?
Which situation is best described by the graph shown?
Find the constant of proportionality in the graph.
See box on the pdf.
Base on the information in the table, what is the constant of proportionality?
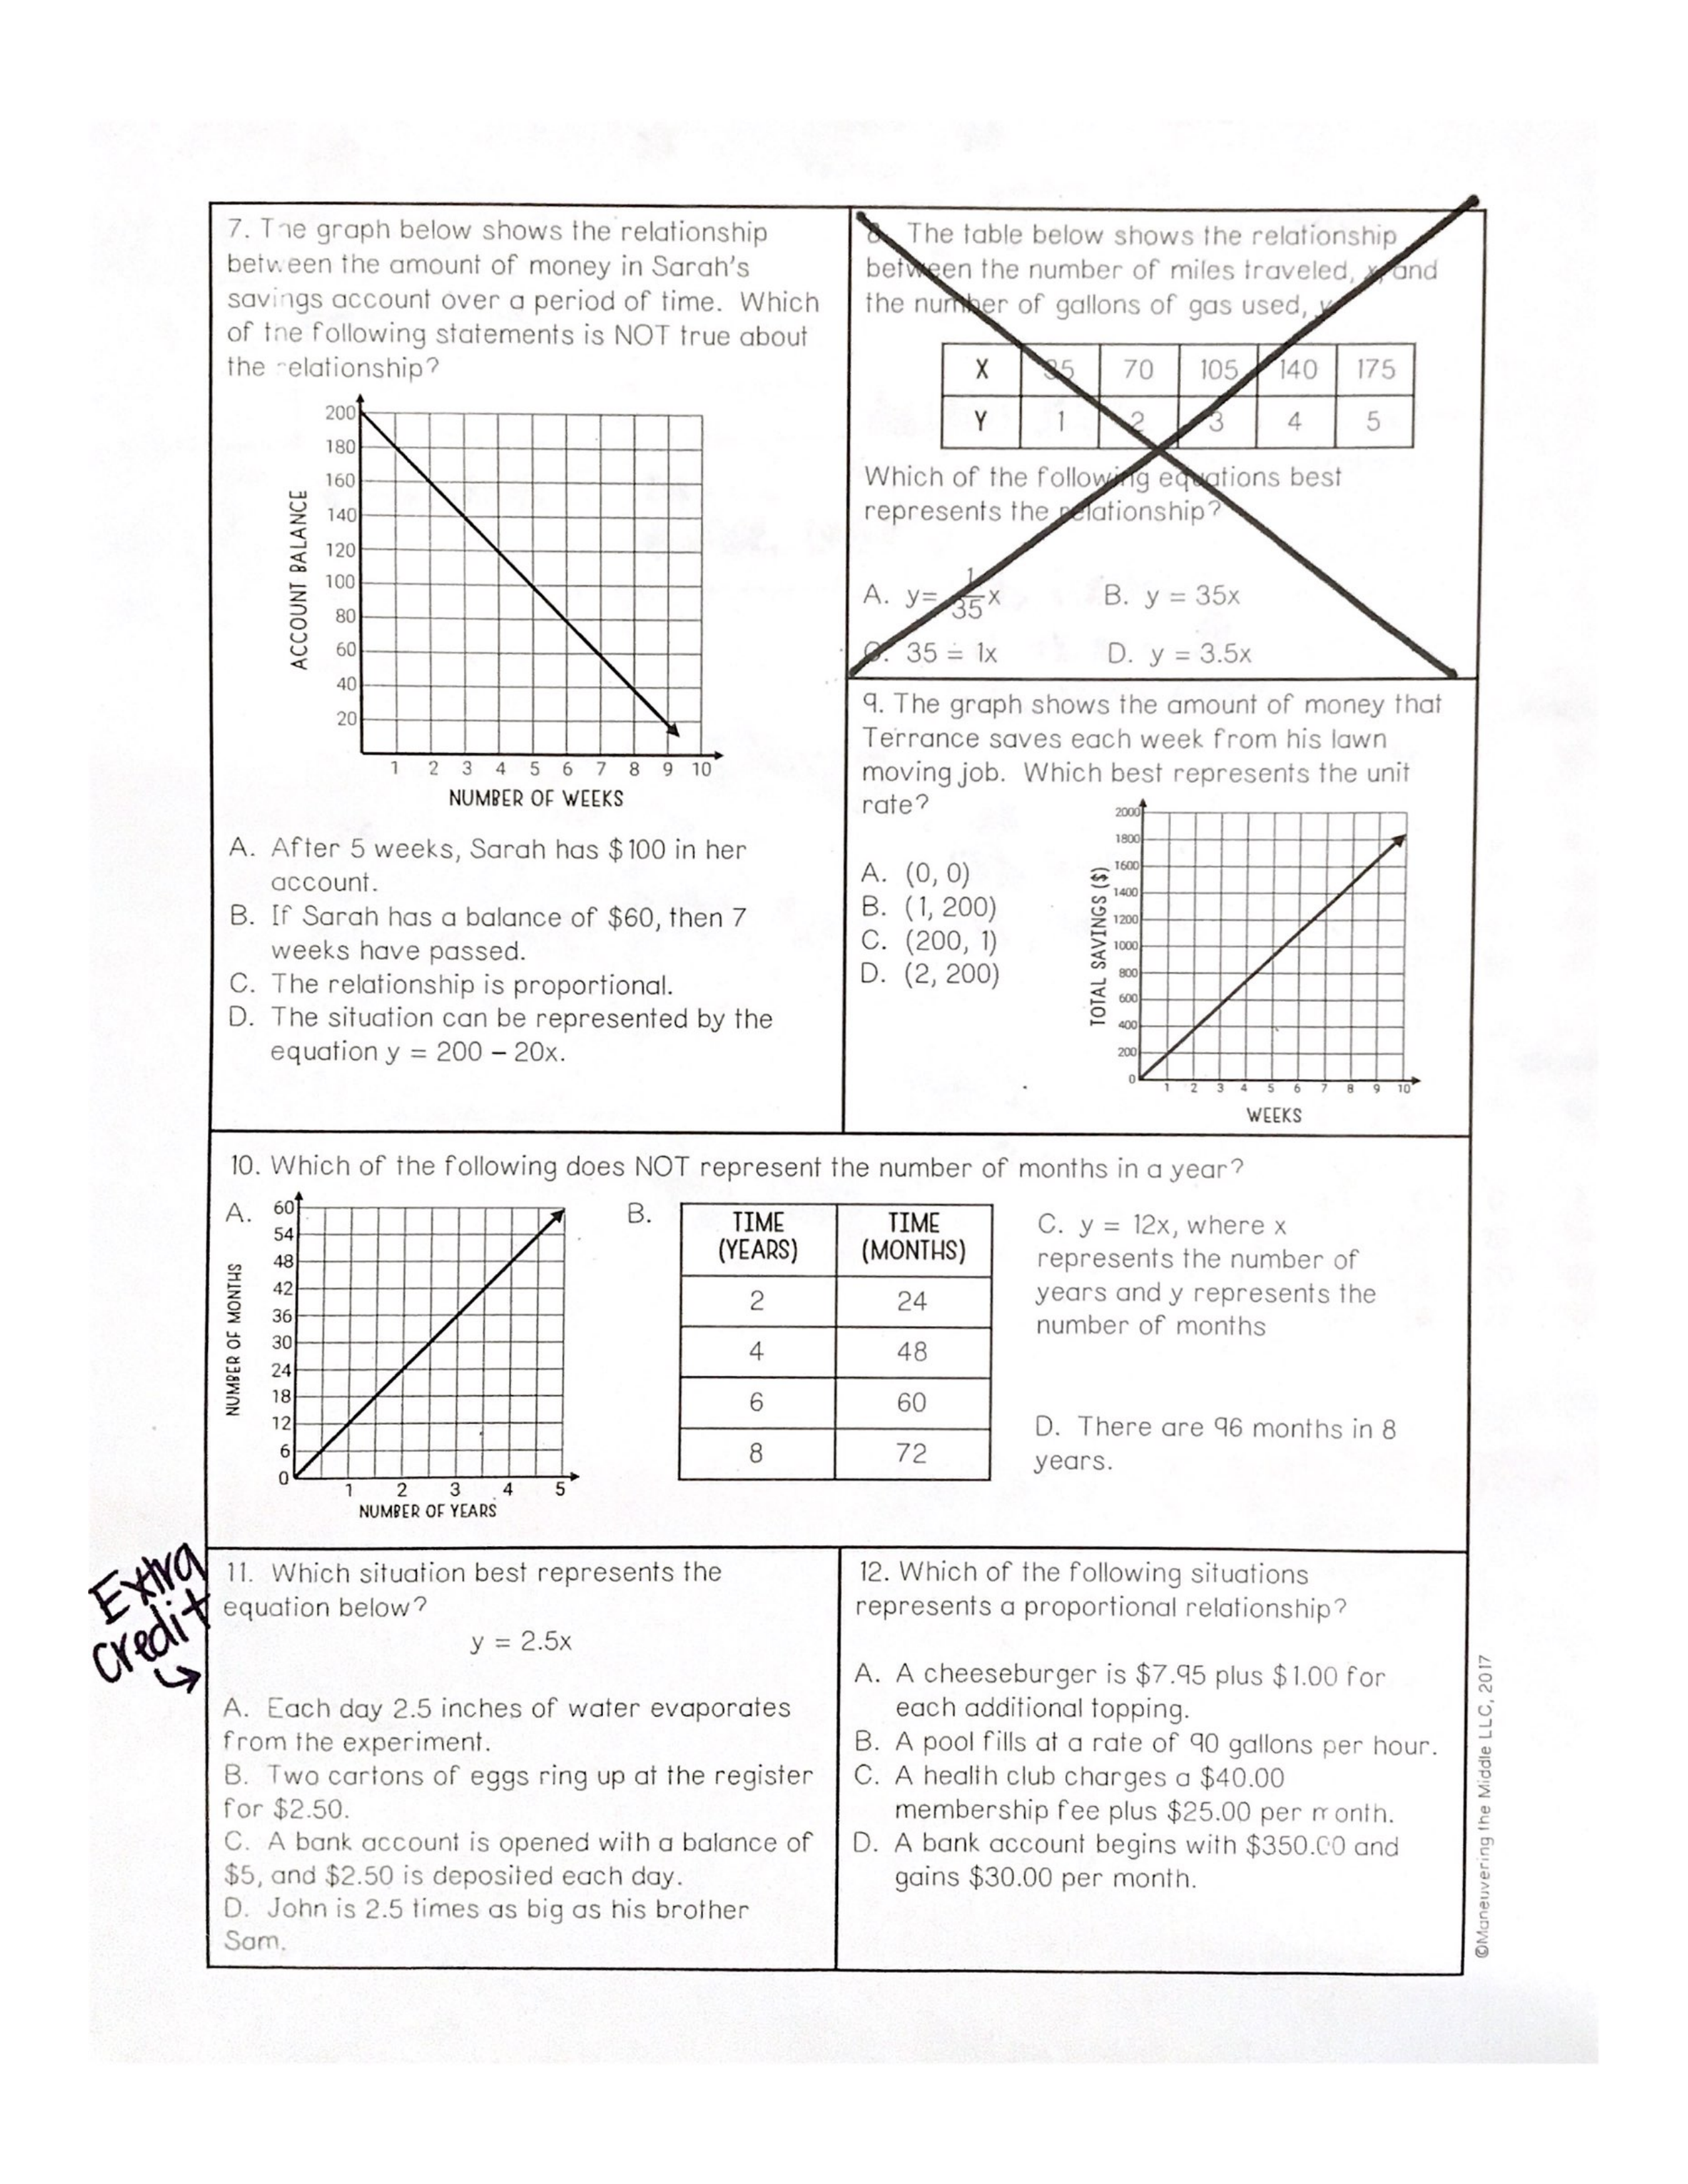
See question #7 on the pdf.
See question #9 on the pdf.
#10: Which representation does NOT represent the number of months in a year?
Which situation represents a proportional relationship?
#14 - Which table is proportional? There may be more than one. Choose ALL that are proportional.
#15 - Write a proportion that could help you figure out how much money Calvin would make in 15 hours. Do this on paper and upload a picture.
#16 - How much will Calvin earn if he works 21 hours?