1
Asemmisa {{asɛmmisaAhyɛnsode}}
1.
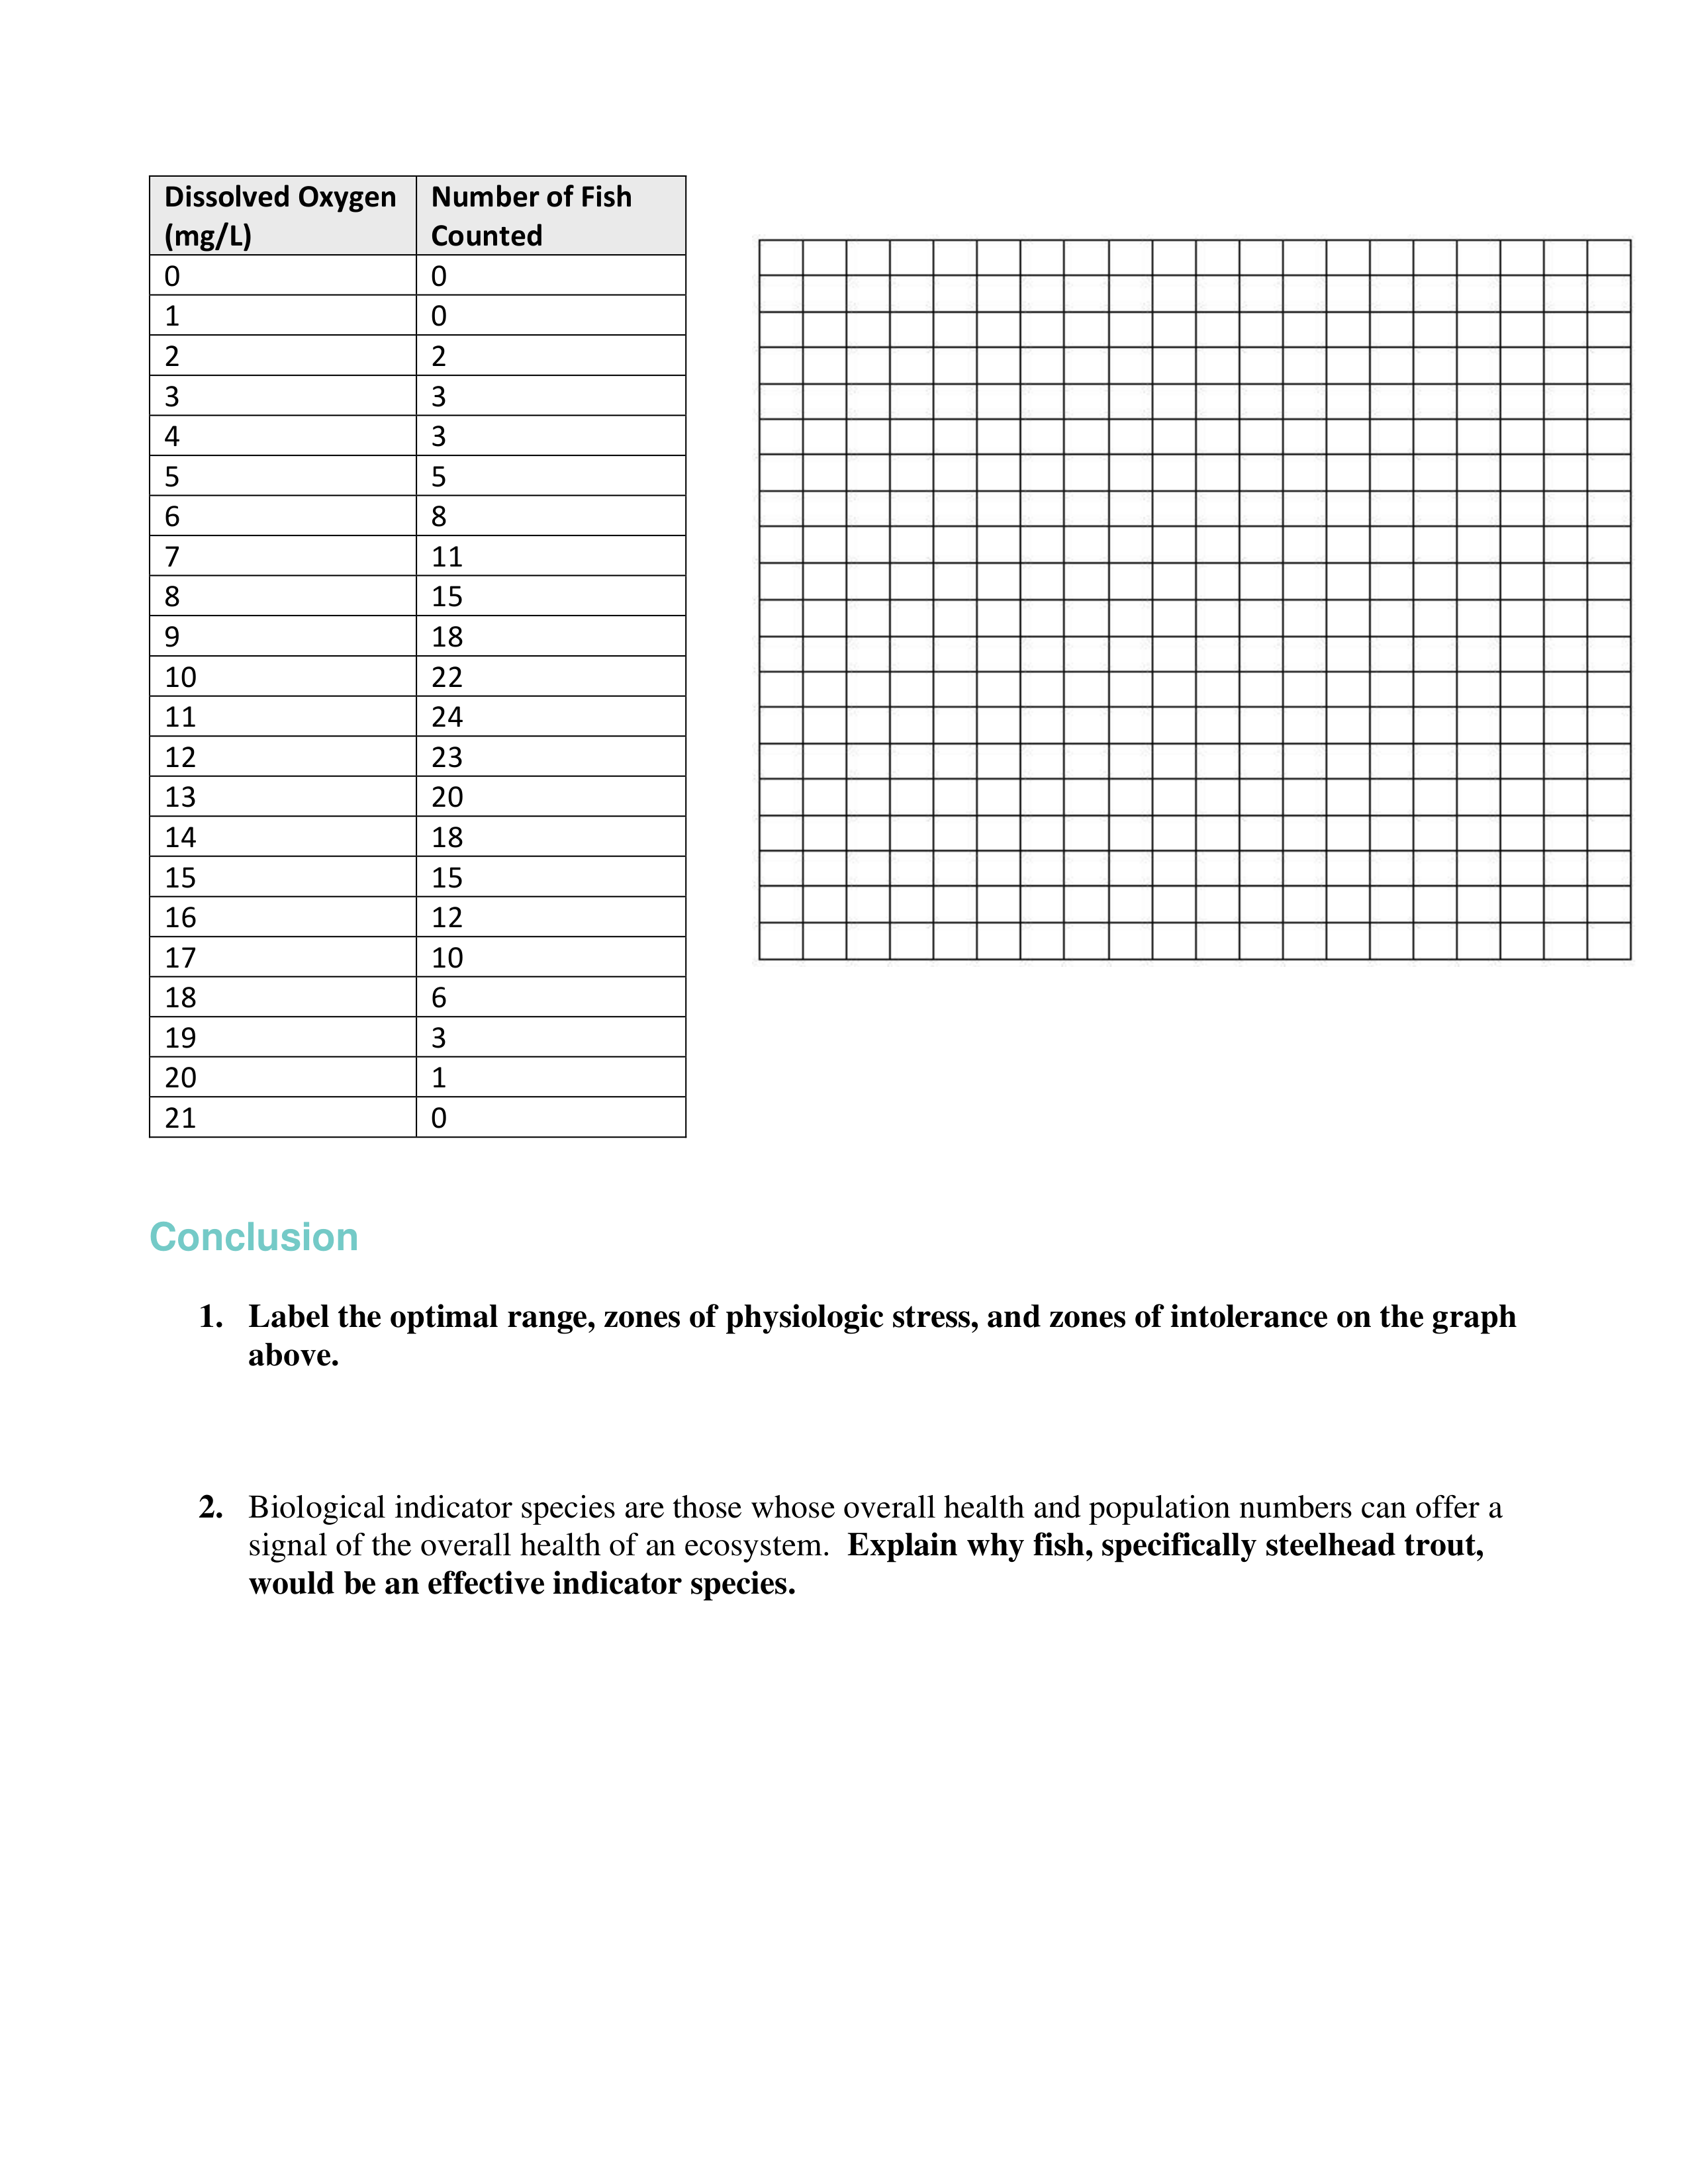
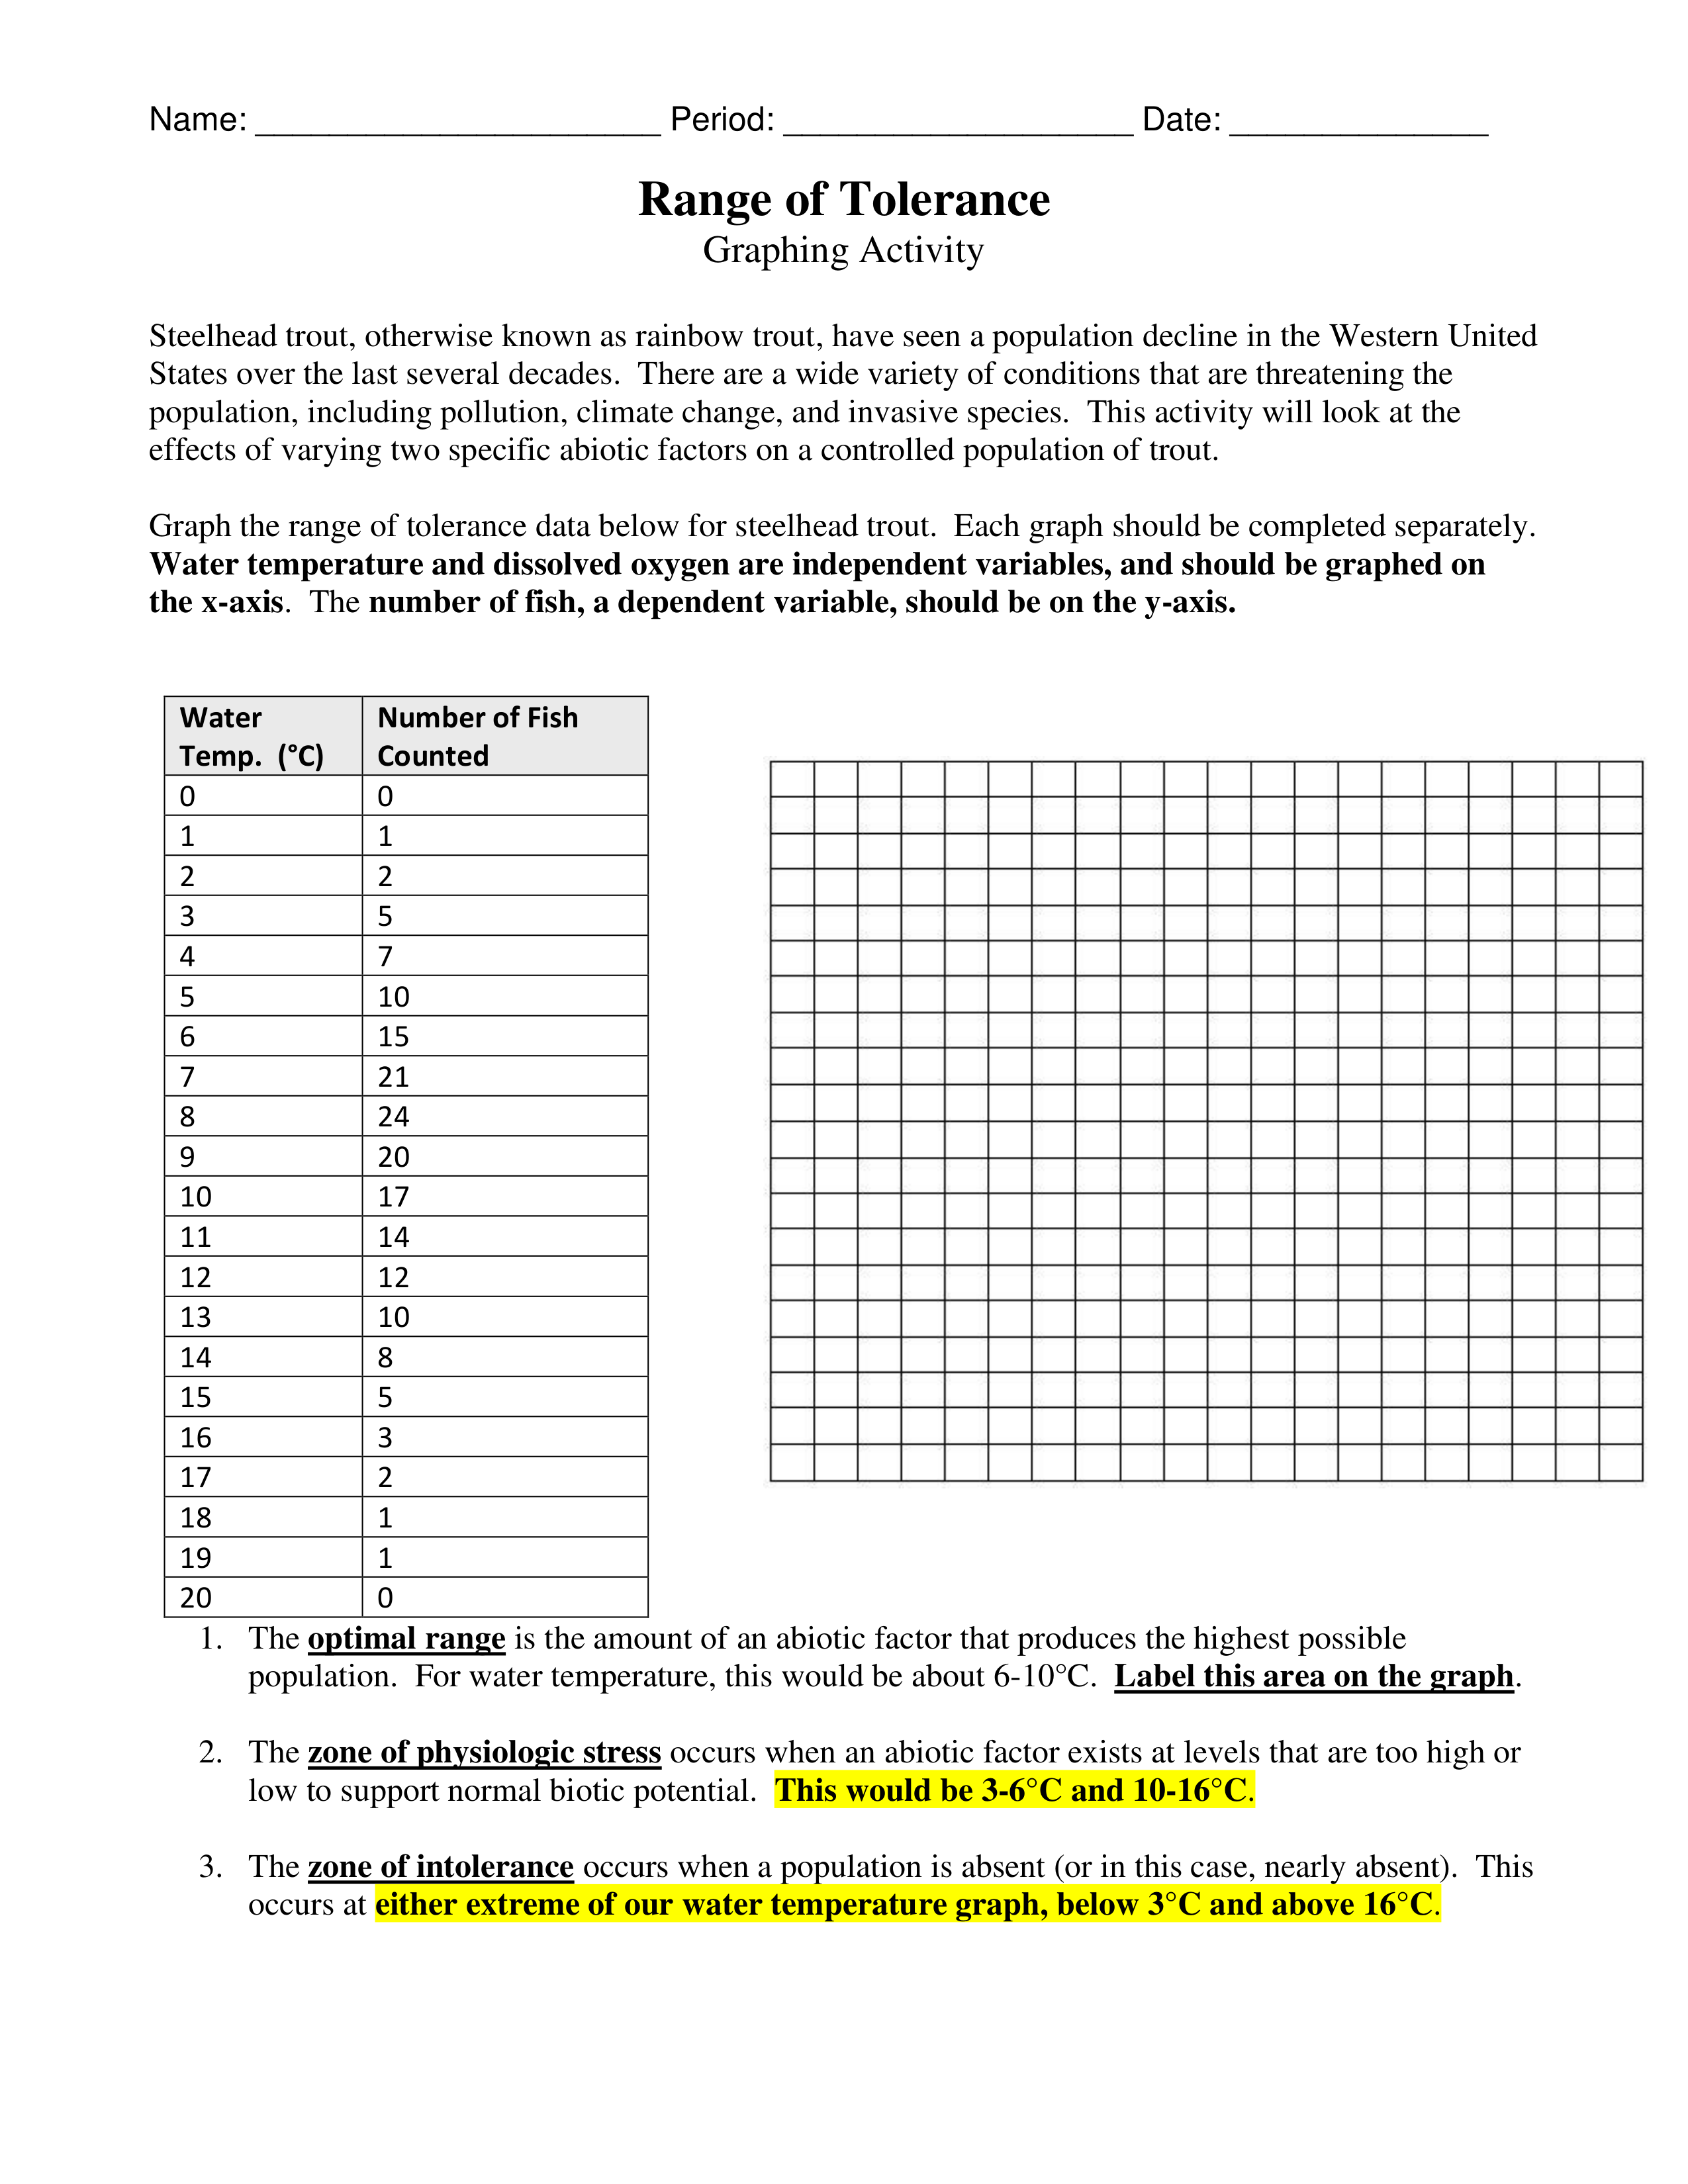
Graph the data in a line graph.
Graph the data in a line graph.
The optimal range is the amount of an abiotic factor that produces the highest possible population. For water temperature, this would be about 6-10°C. Label this area on the graph.
The zone of physiologic stress occurs when an abiotic factor exists at levels that are too high or low to support normal biotic potential. This would be 3-6°C and 10-16°C.
The zone of intolerance occurs when a population is absent (or in this case, nearly absent). This occurs at either extreme of our water temperature graph, below 3°C and above 16°C.