Math 7 Unit 2 Assessment
star
star
star
star
star
Posljednje ažuriranje almost 6 years ago
9
Napomena autora:
Kendall Hunt Illustrative Mathematics
2
Kendall Hunt Illustrative Mathematics
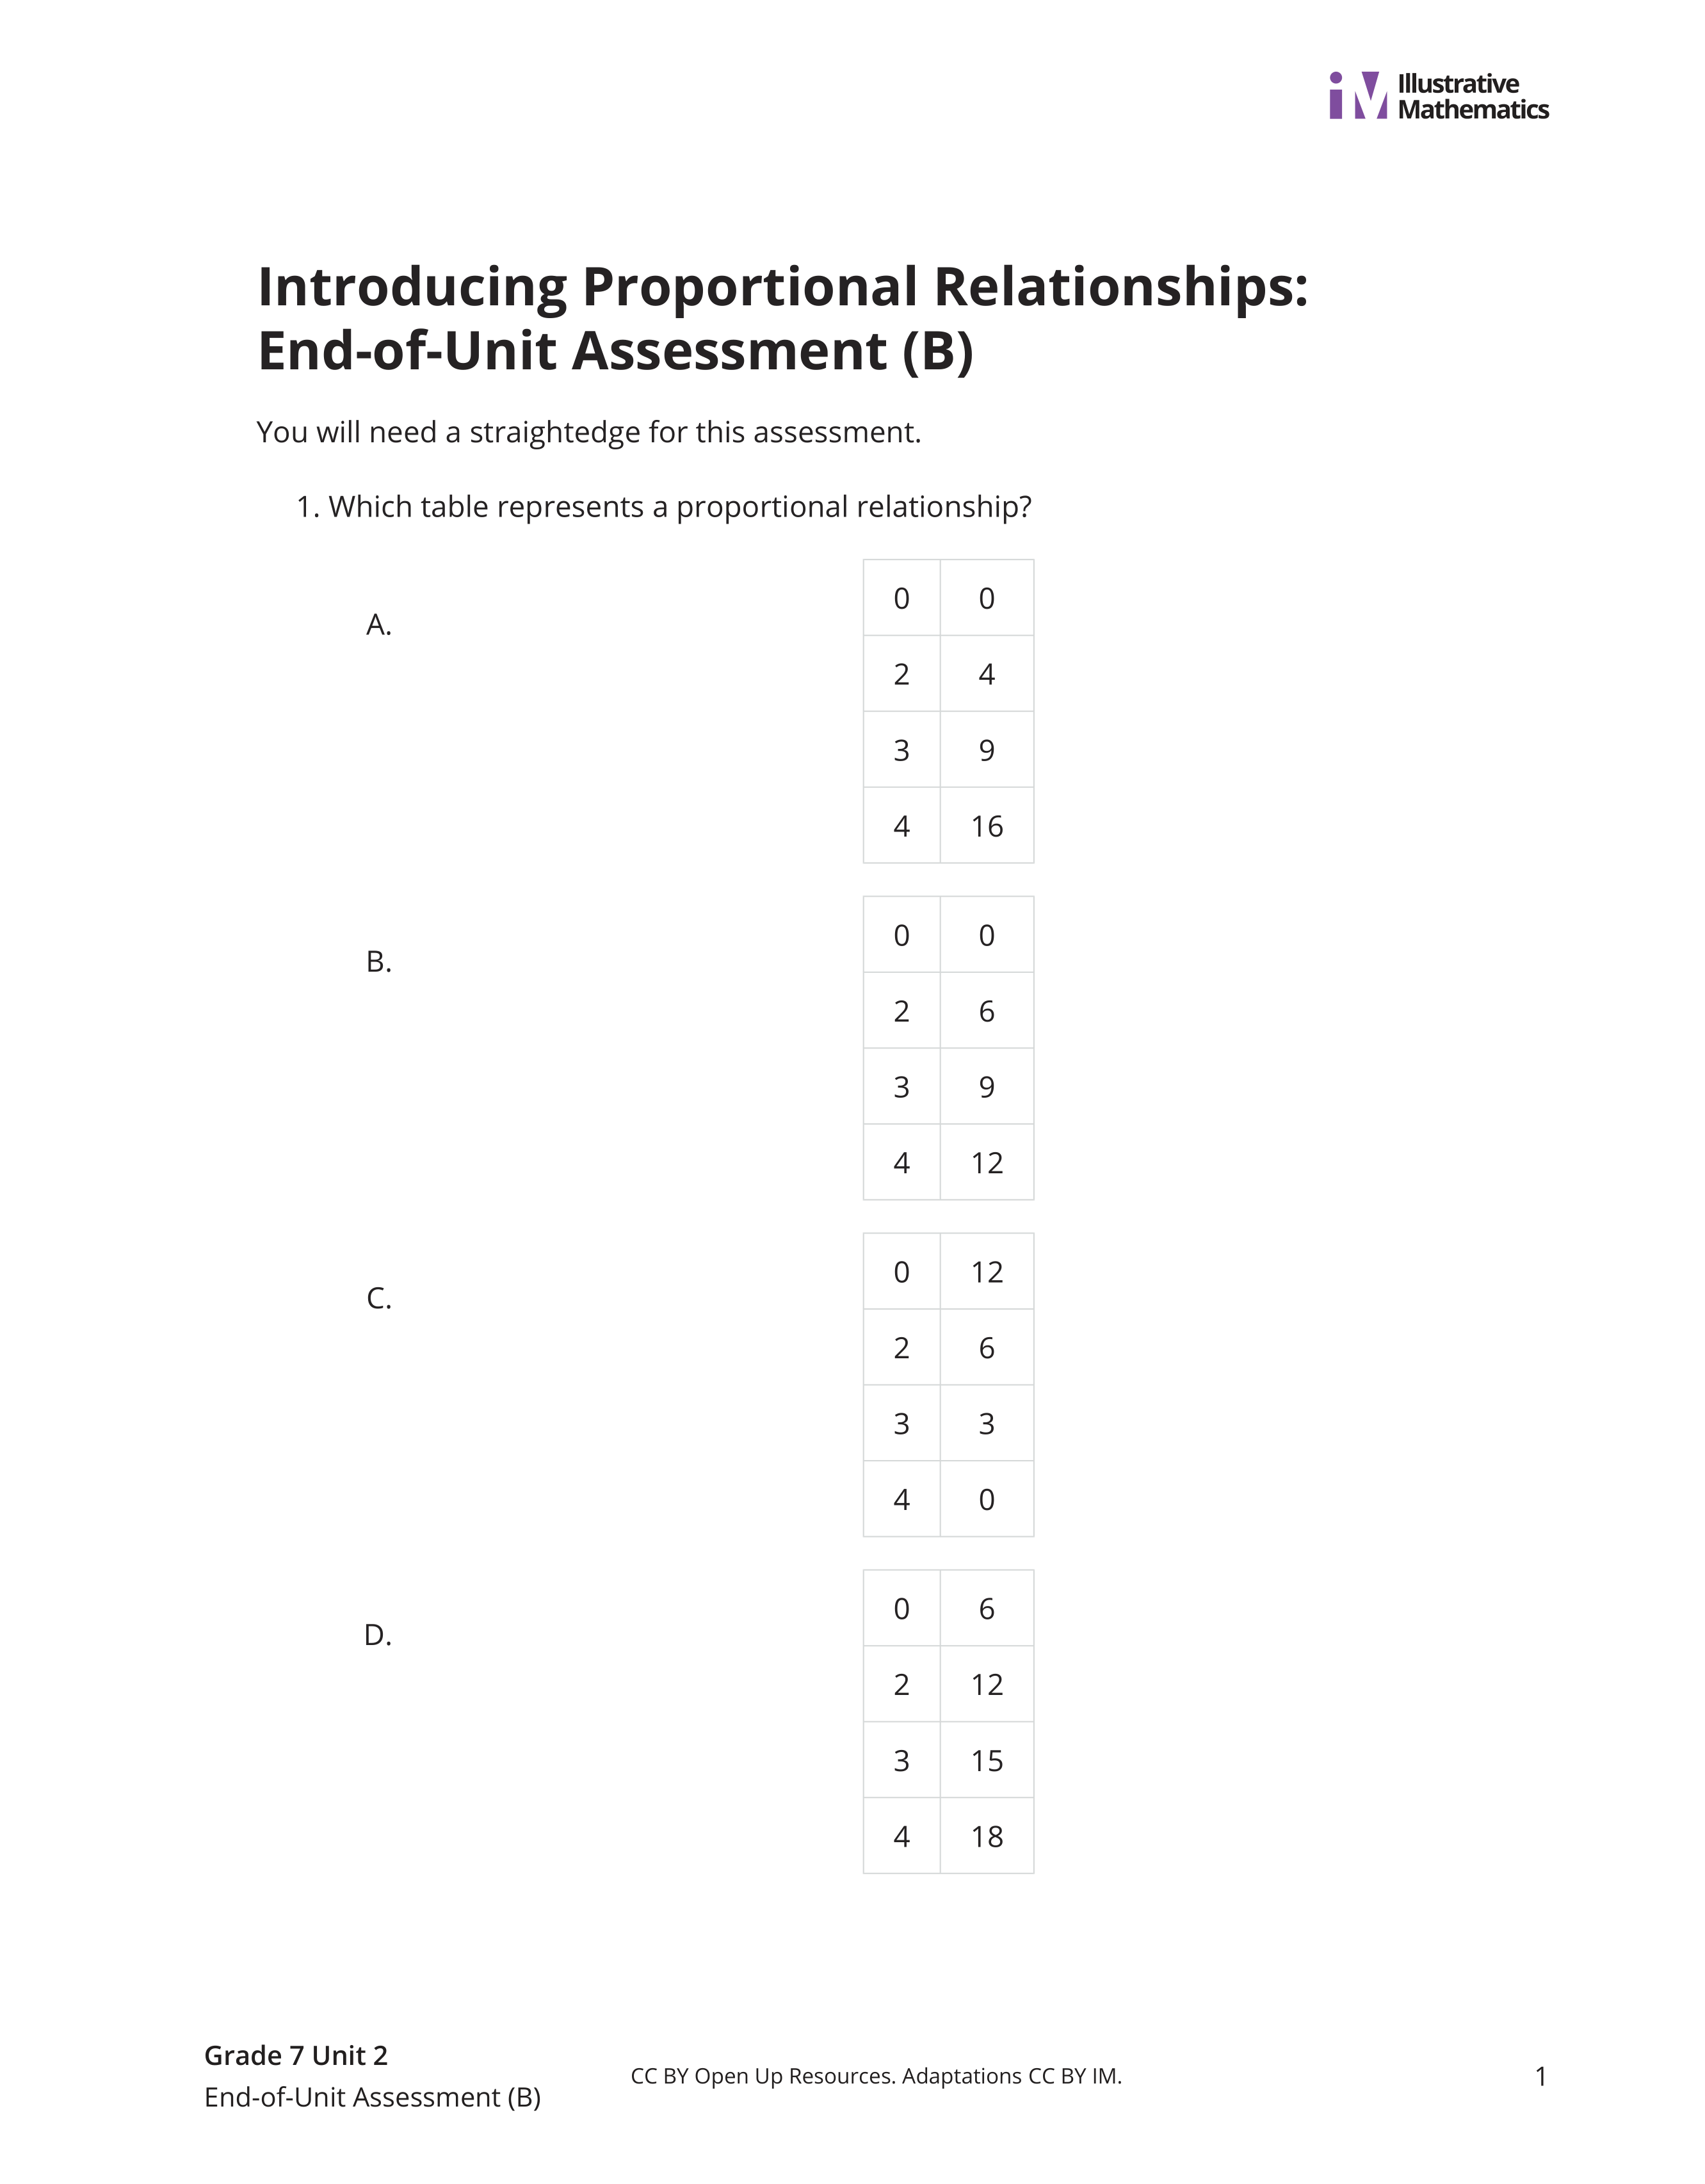
Which table represents a proportional relationship? Explain how you know.
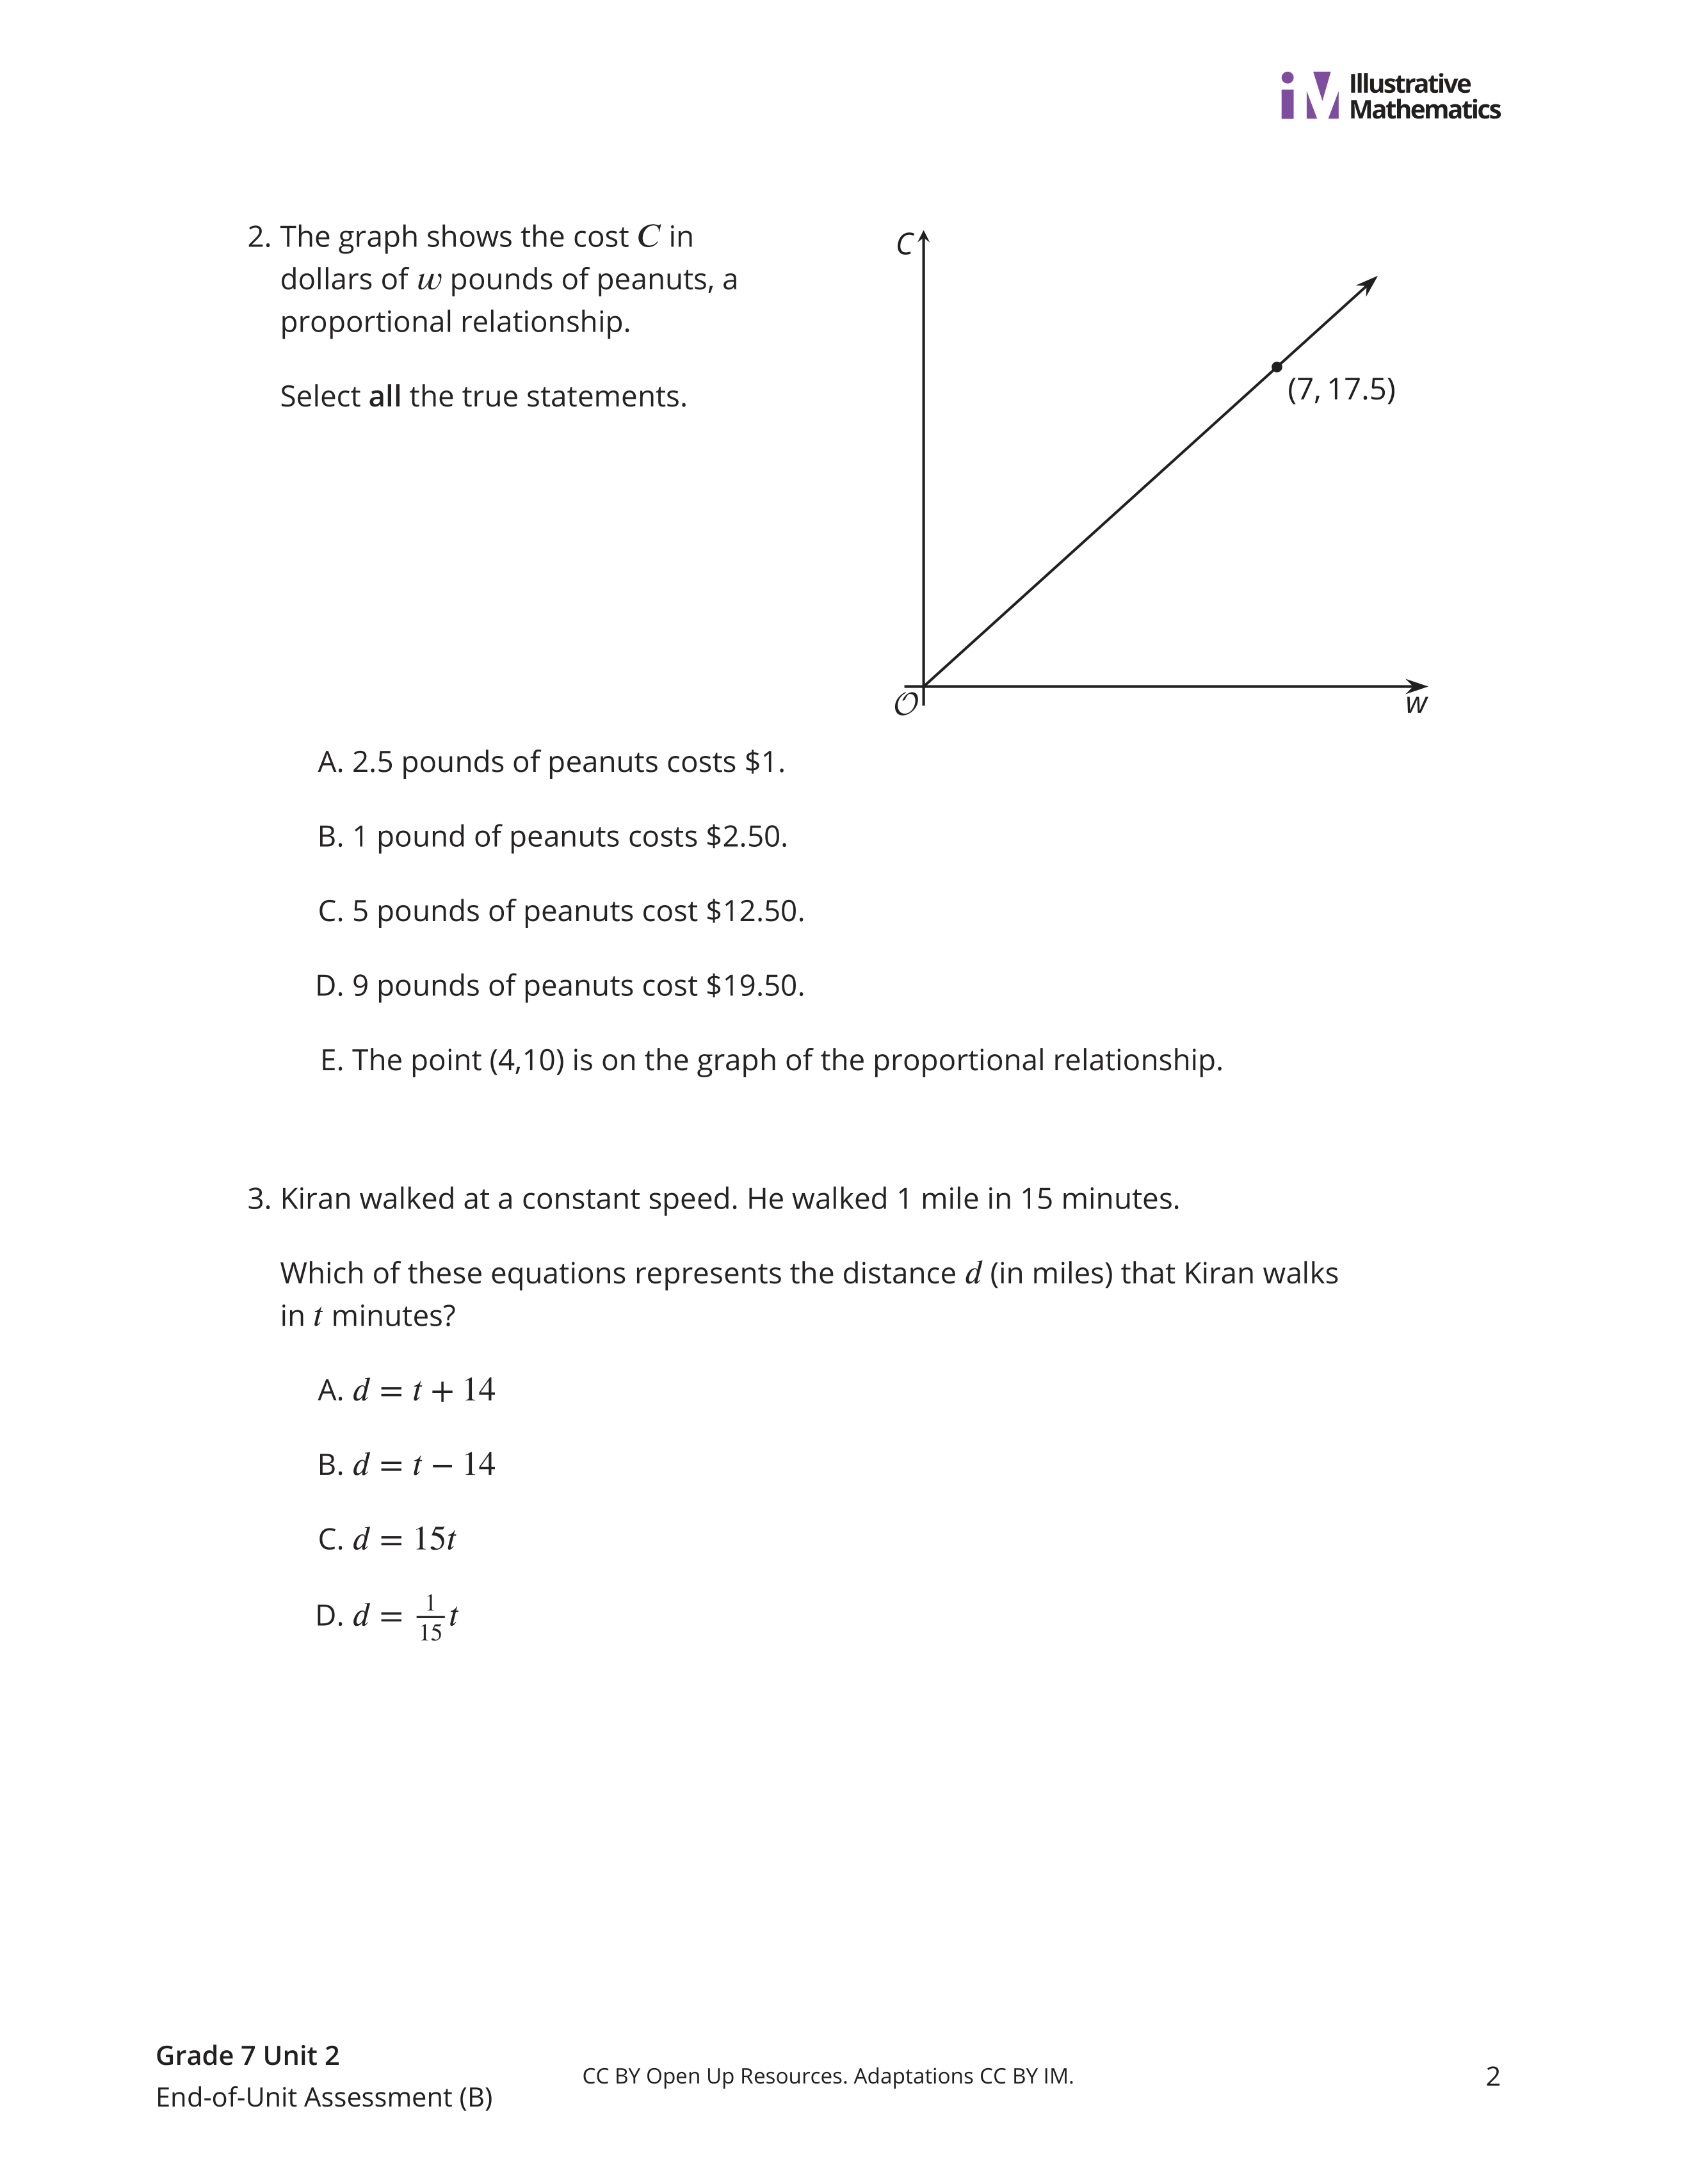
The graph shows the cost C in dollars of w pounds of peanuts, a proportional relationship.
Select all the true statements. Show your work.
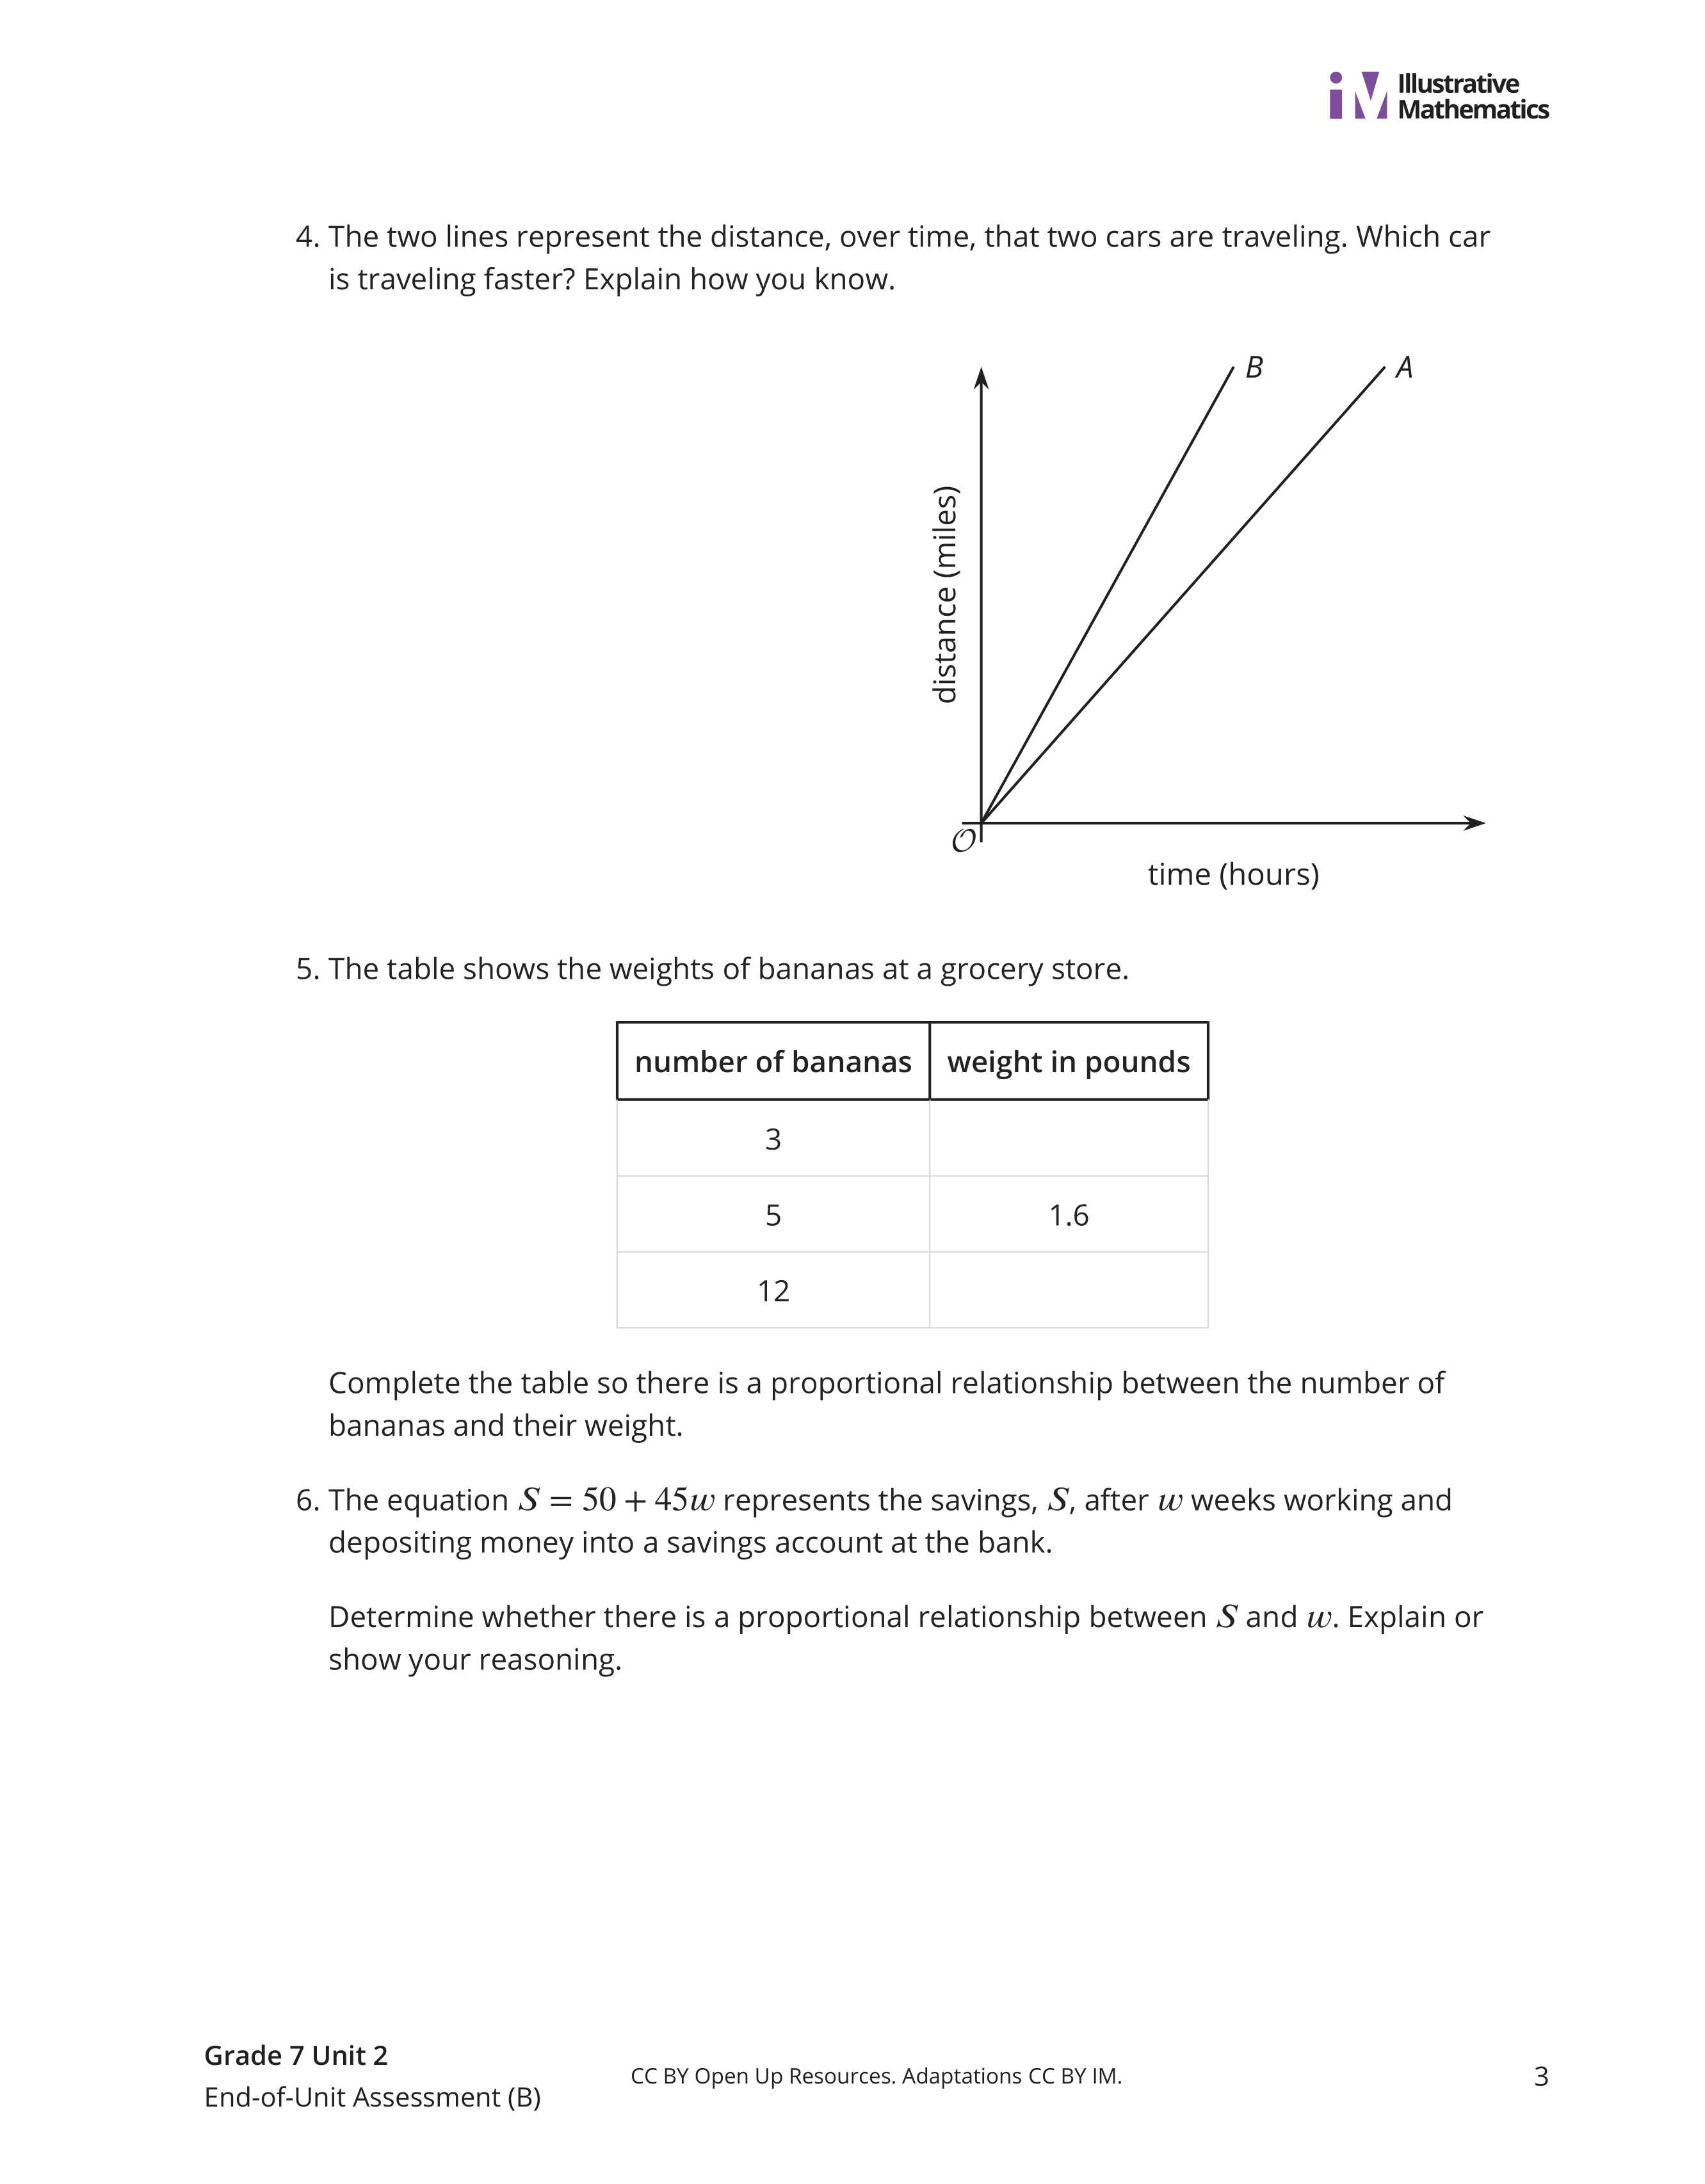
The two lines represent the distance, over time, that two cars are traveling. Which car is traveling faster? EXPLAIN how you know.
Complete the table so there is a proportional relationship between the number of bananas and their weight.
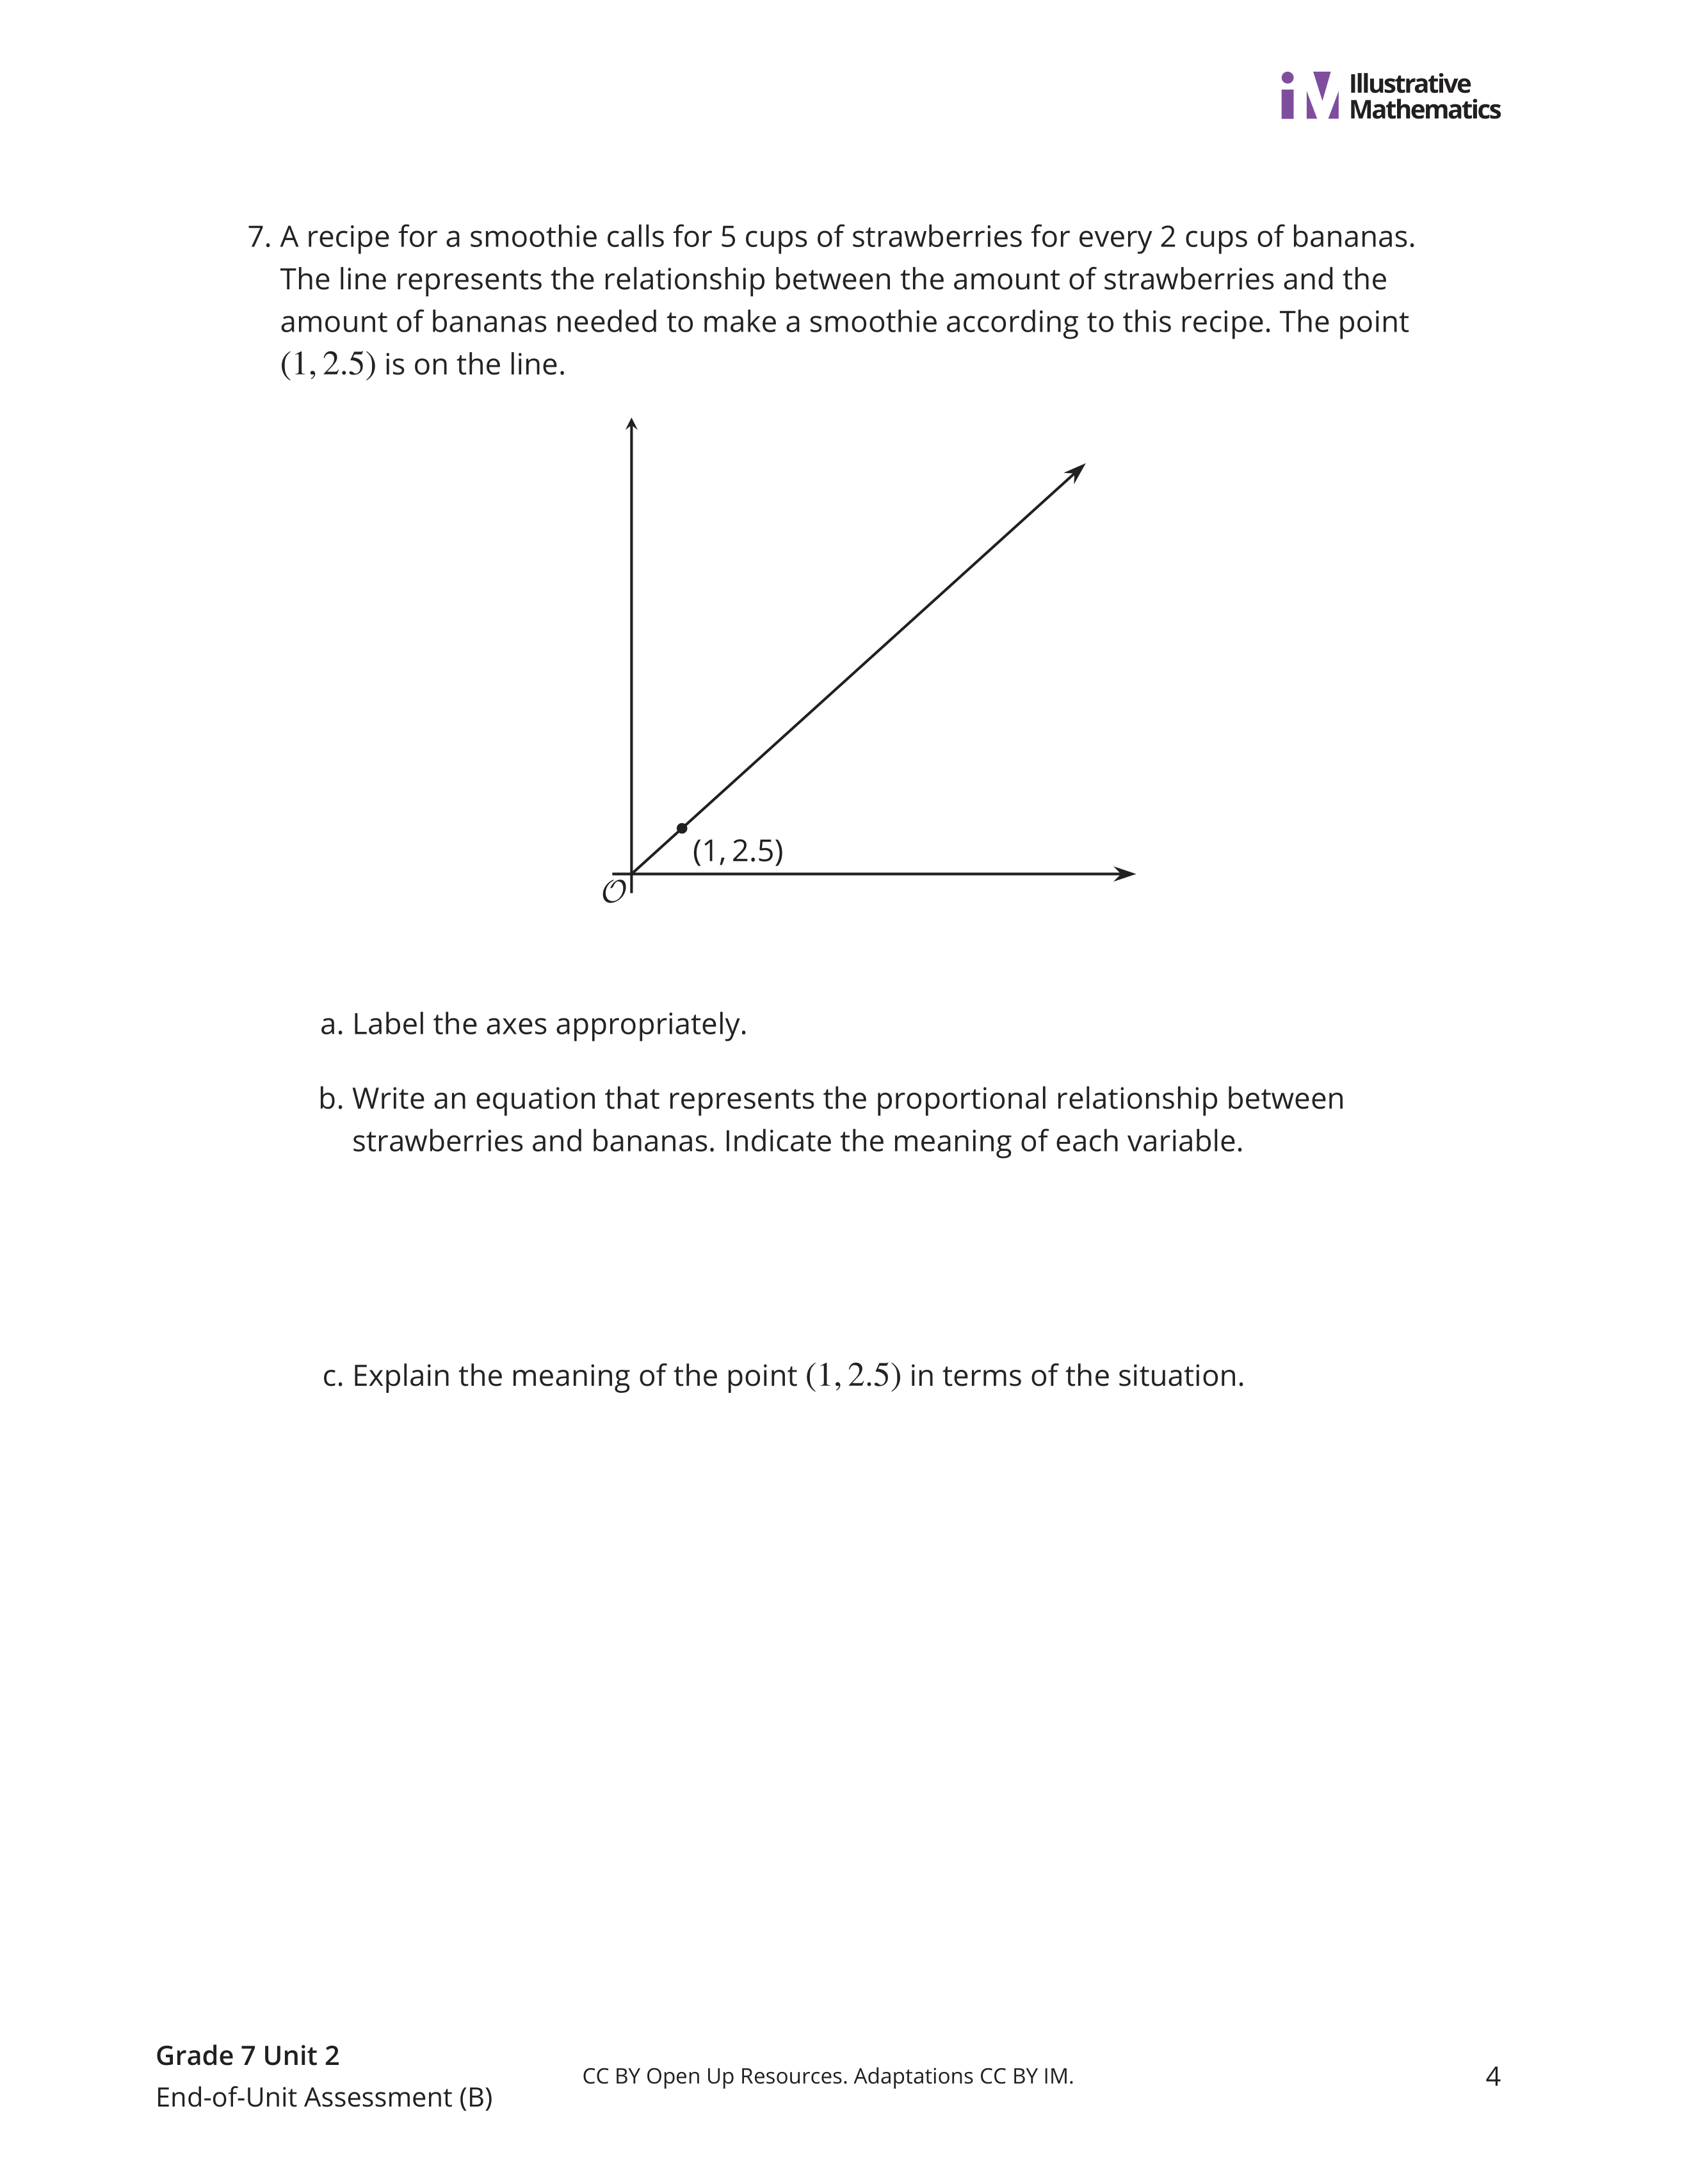
Label the axes appropriately.
Write an equation that represents the proportional relationship between strawberries and bananas. Indicate the meaning of each variable.
Explain the meaning of the point (1, 2.5) in terms of the situation.
Kiran walked at a constant speed. He walked 1 mile in 15 minutes.
Which of these equations represents the distance d (in miles) that Kiran walks in t minutes? SHOW YOUR WORK!
There is a proportional relationhip between S and w. EXPLAIN or SHOW YOUR REASONING.