Graphing Linear Inequalities
star
star
star
star
star
Posljednje ažuriranje about 4 years ago
7
1
1
1
1
1
1
1
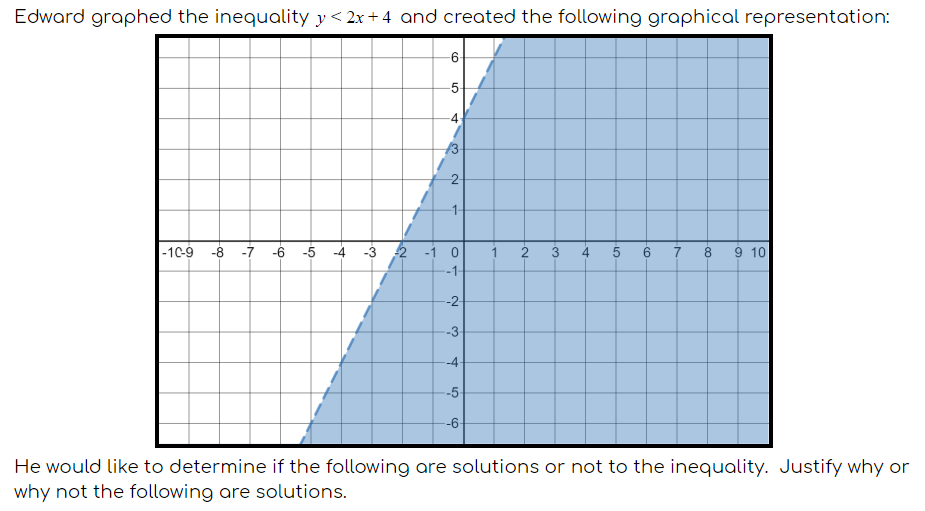
Decide if each of these is a solution, not a solution, or if we need more information to decide. (Based on the graph above.)
(0, 6)
x = 2 and y = 3
x = 9
(-1, 2)
Solution
Not a Solution
Need More Information
Match the equation to the graph
| Stavka koja se može prevući | arrow_right_alt | Odgovarajuća stavka |
|---|---|---|
| arrow_right_alt |
|
| arrow_right_alt |
|
| arrow_right_alt |
|
| arrow_right_alt |
|
Graph the inequality y > -2x + 9
Is (3, 3) a solution to the inequality above?
Is (0, 0) a solution to the inequality above?
Graph the inequality
List two points that are solutions to the inequality above


