
1
In a controlled experiment,
In a controlled experiment,
1
1
1
In a controlled experiment,
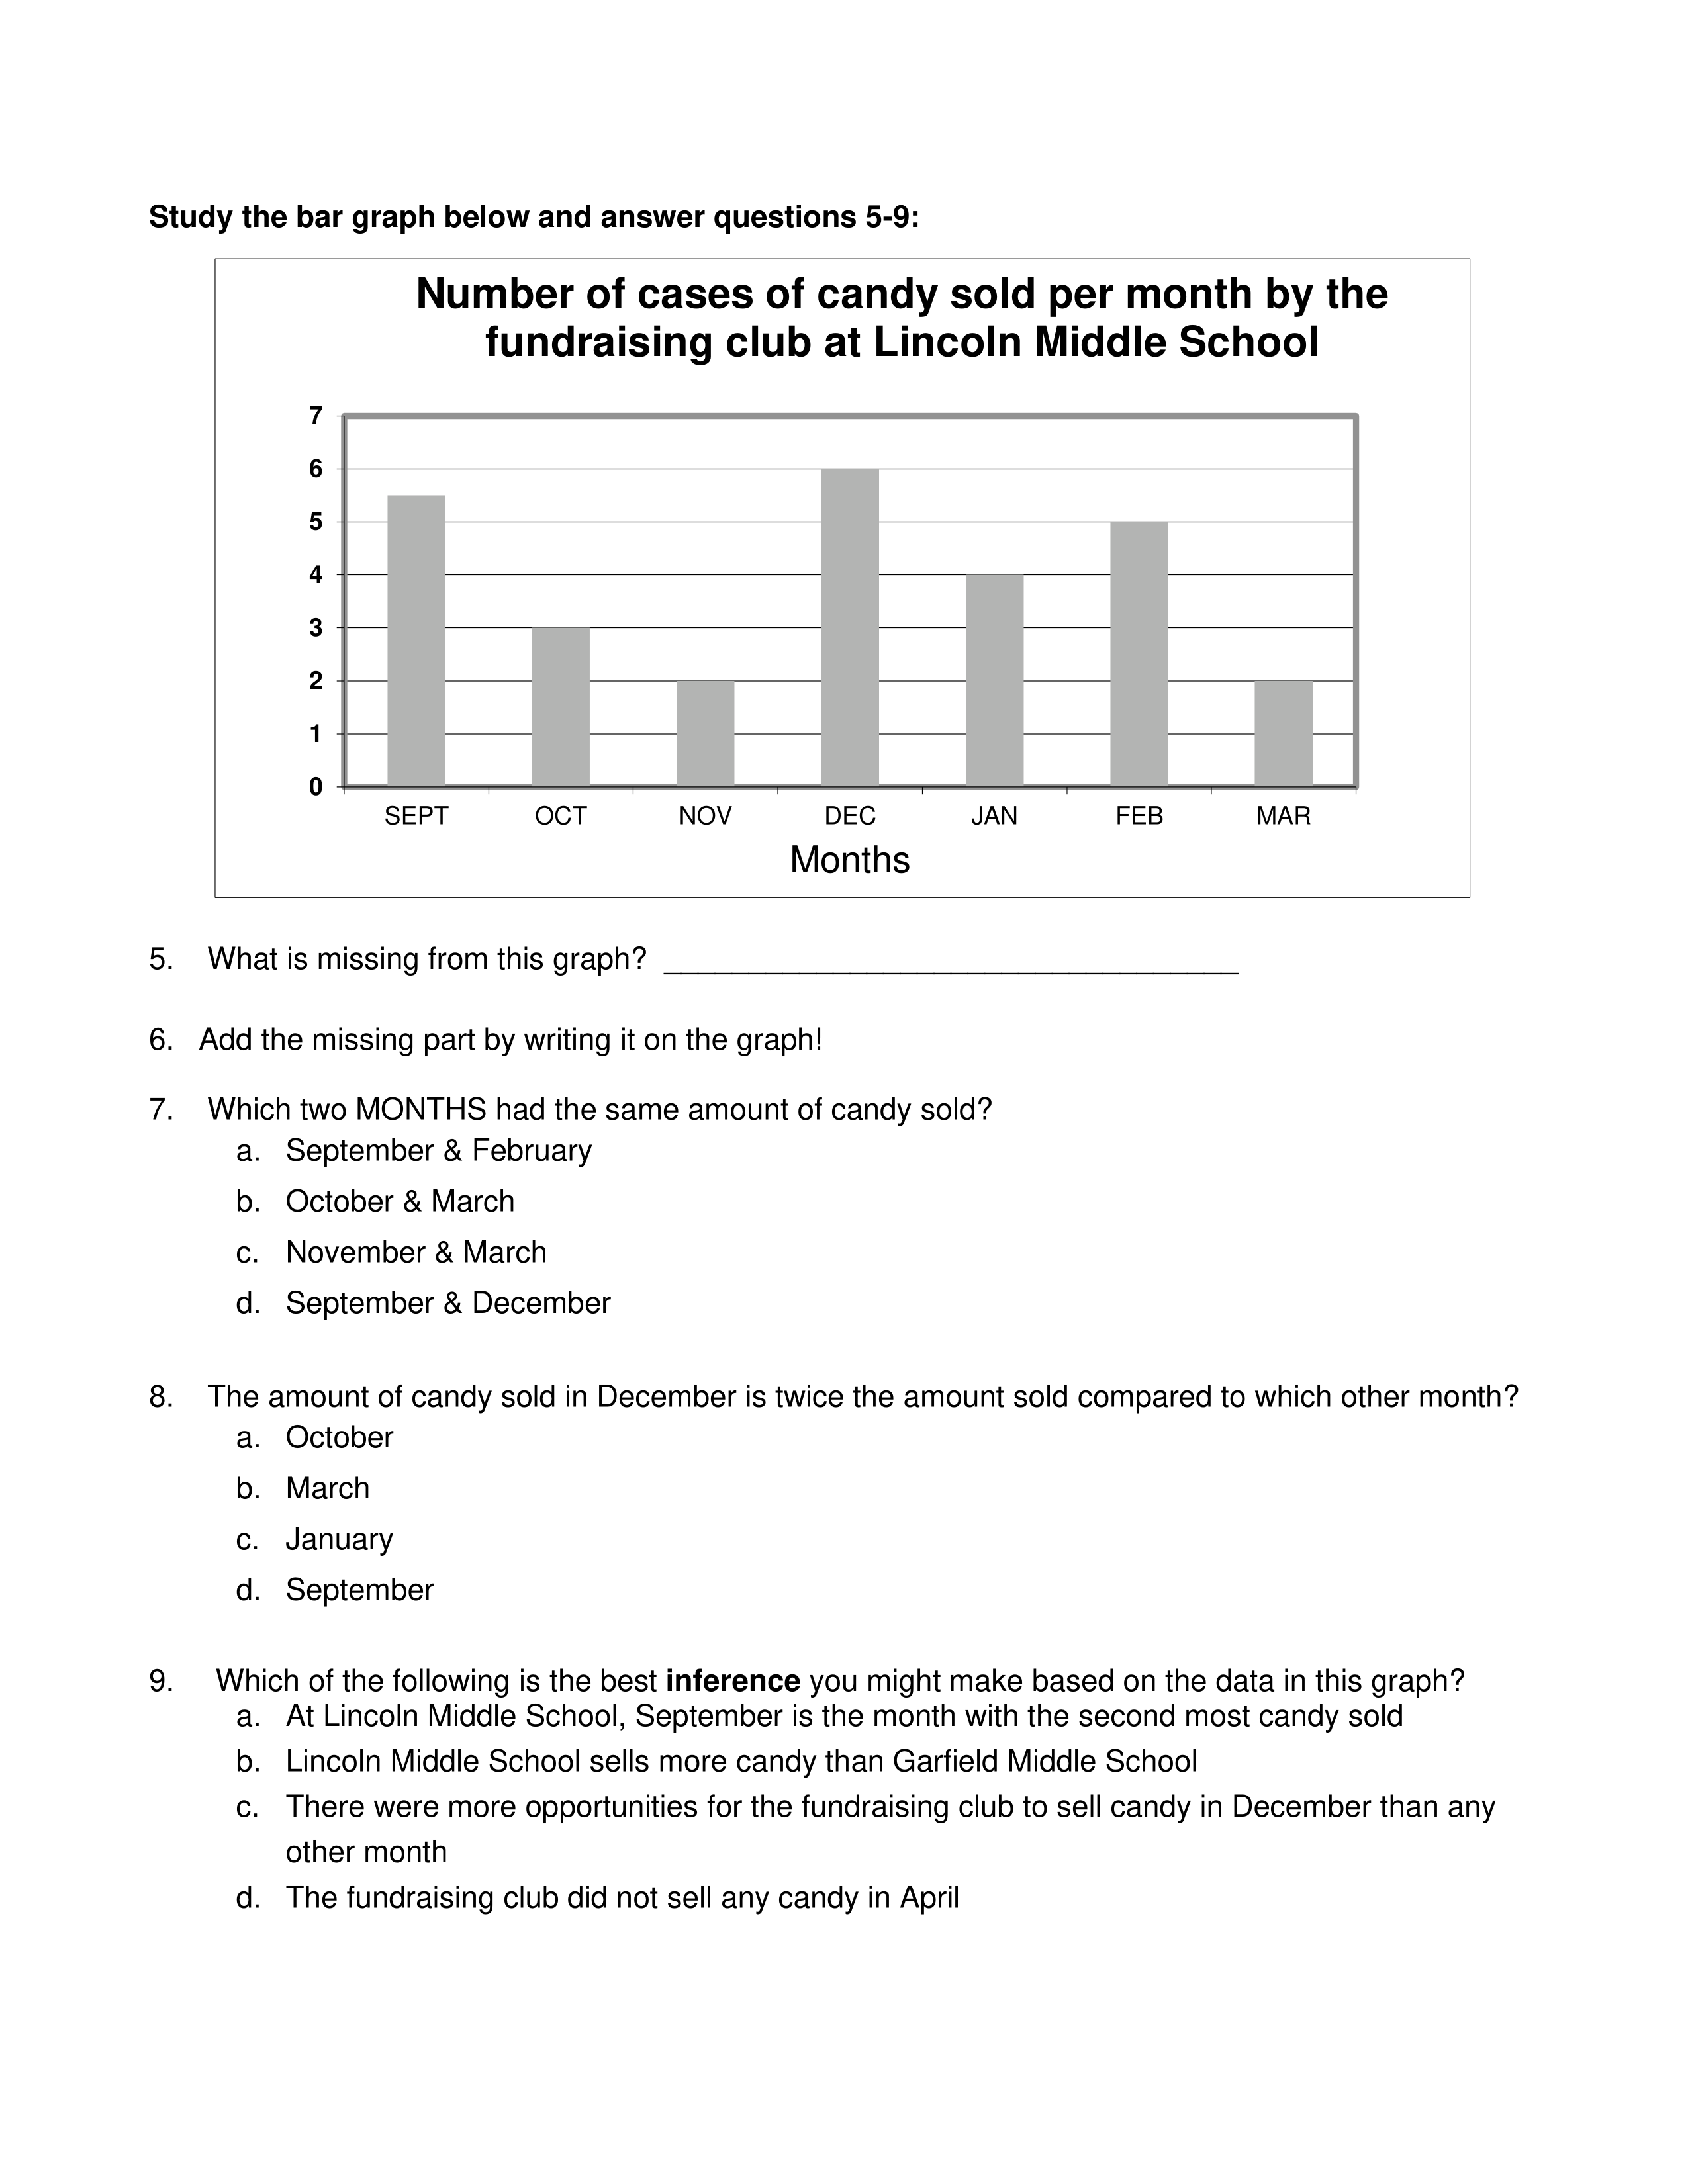
What is missing from this graph?
What should the missing part say? Where would the missing part go on the graph?

Write Principal Diaz's experimental question or problem statement below.

Time that students arrive to class
Color of backpacks
Which factor is the independent variable?
Which of the following ideas could be tested with this experiment?
Which of the following is the best reason why the portland rose plant is included in all the groupd to be studied?
Which two months had the same amount of candy sold?
The amount of candy sold in December is twice the amount sold compared to which other month?
Which of the
Use the data table to clearly label the scatter plot with the students' names. (You can use a stylus to draw on the image.)
Re-write Principal Diaz's hypothesis in the correct format.
What is the independent variable in her experiment?
What is the dependent variable in her experiment?
What is the control group for this experiment?
List two control variables included in her experiment.
A graph to display the average resting pulse rate for sections of DXSF 7th grade
A graph to display how temperature of wax changes over time as you heat the wax
Write a one sentence observation that includes all the important patterns or trends shown in the graph.
Write a one sentence inference about your observation that can be drawn based on the information shown in the graph and in the paragraph.