Math 7 Unit 2 Retake
star
star
star
star
star
Posljednje ažuriranje almost 6 years ago
9
Napomena autora:
Kendall Hunt Illustrative Mathematics
2
5
Kendall Hunt Illustrative Mathematics
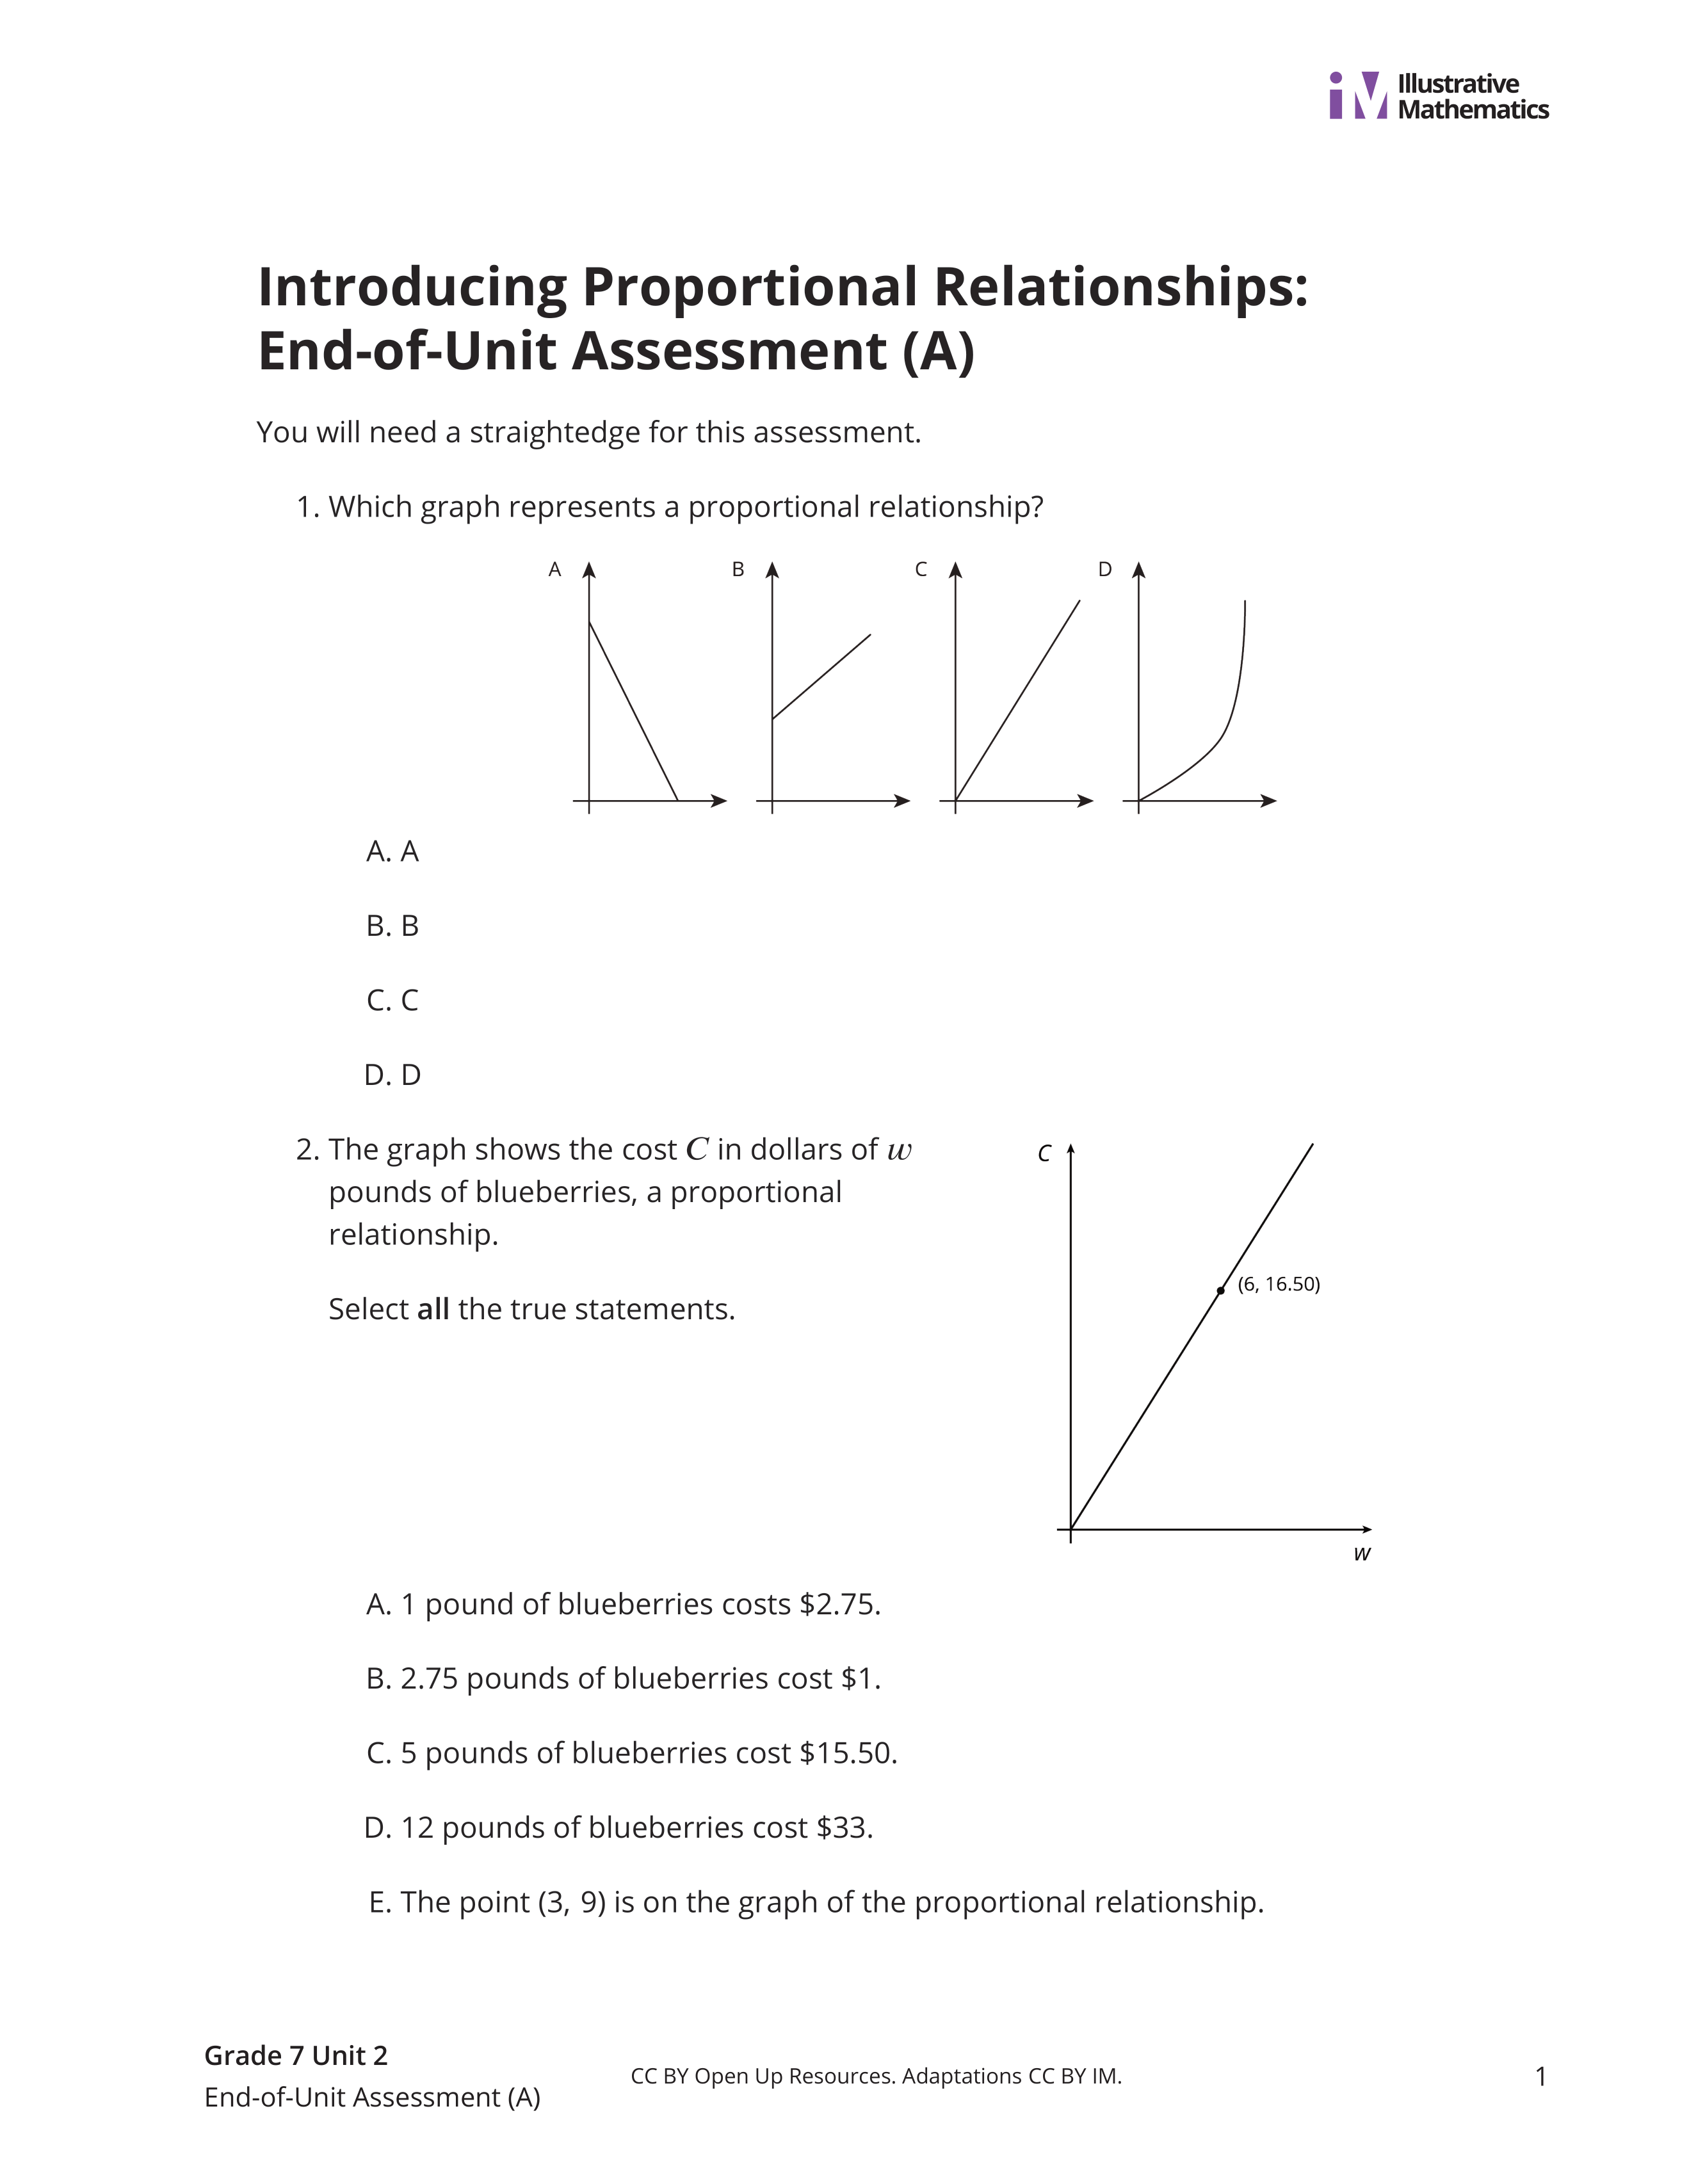
Which graph represents a proportional relationship? Explain your thinking.
The graph shows the cost C in dollars of w pounds of blueberries, a proportional relationship.
Select all the true statements. Show your work.
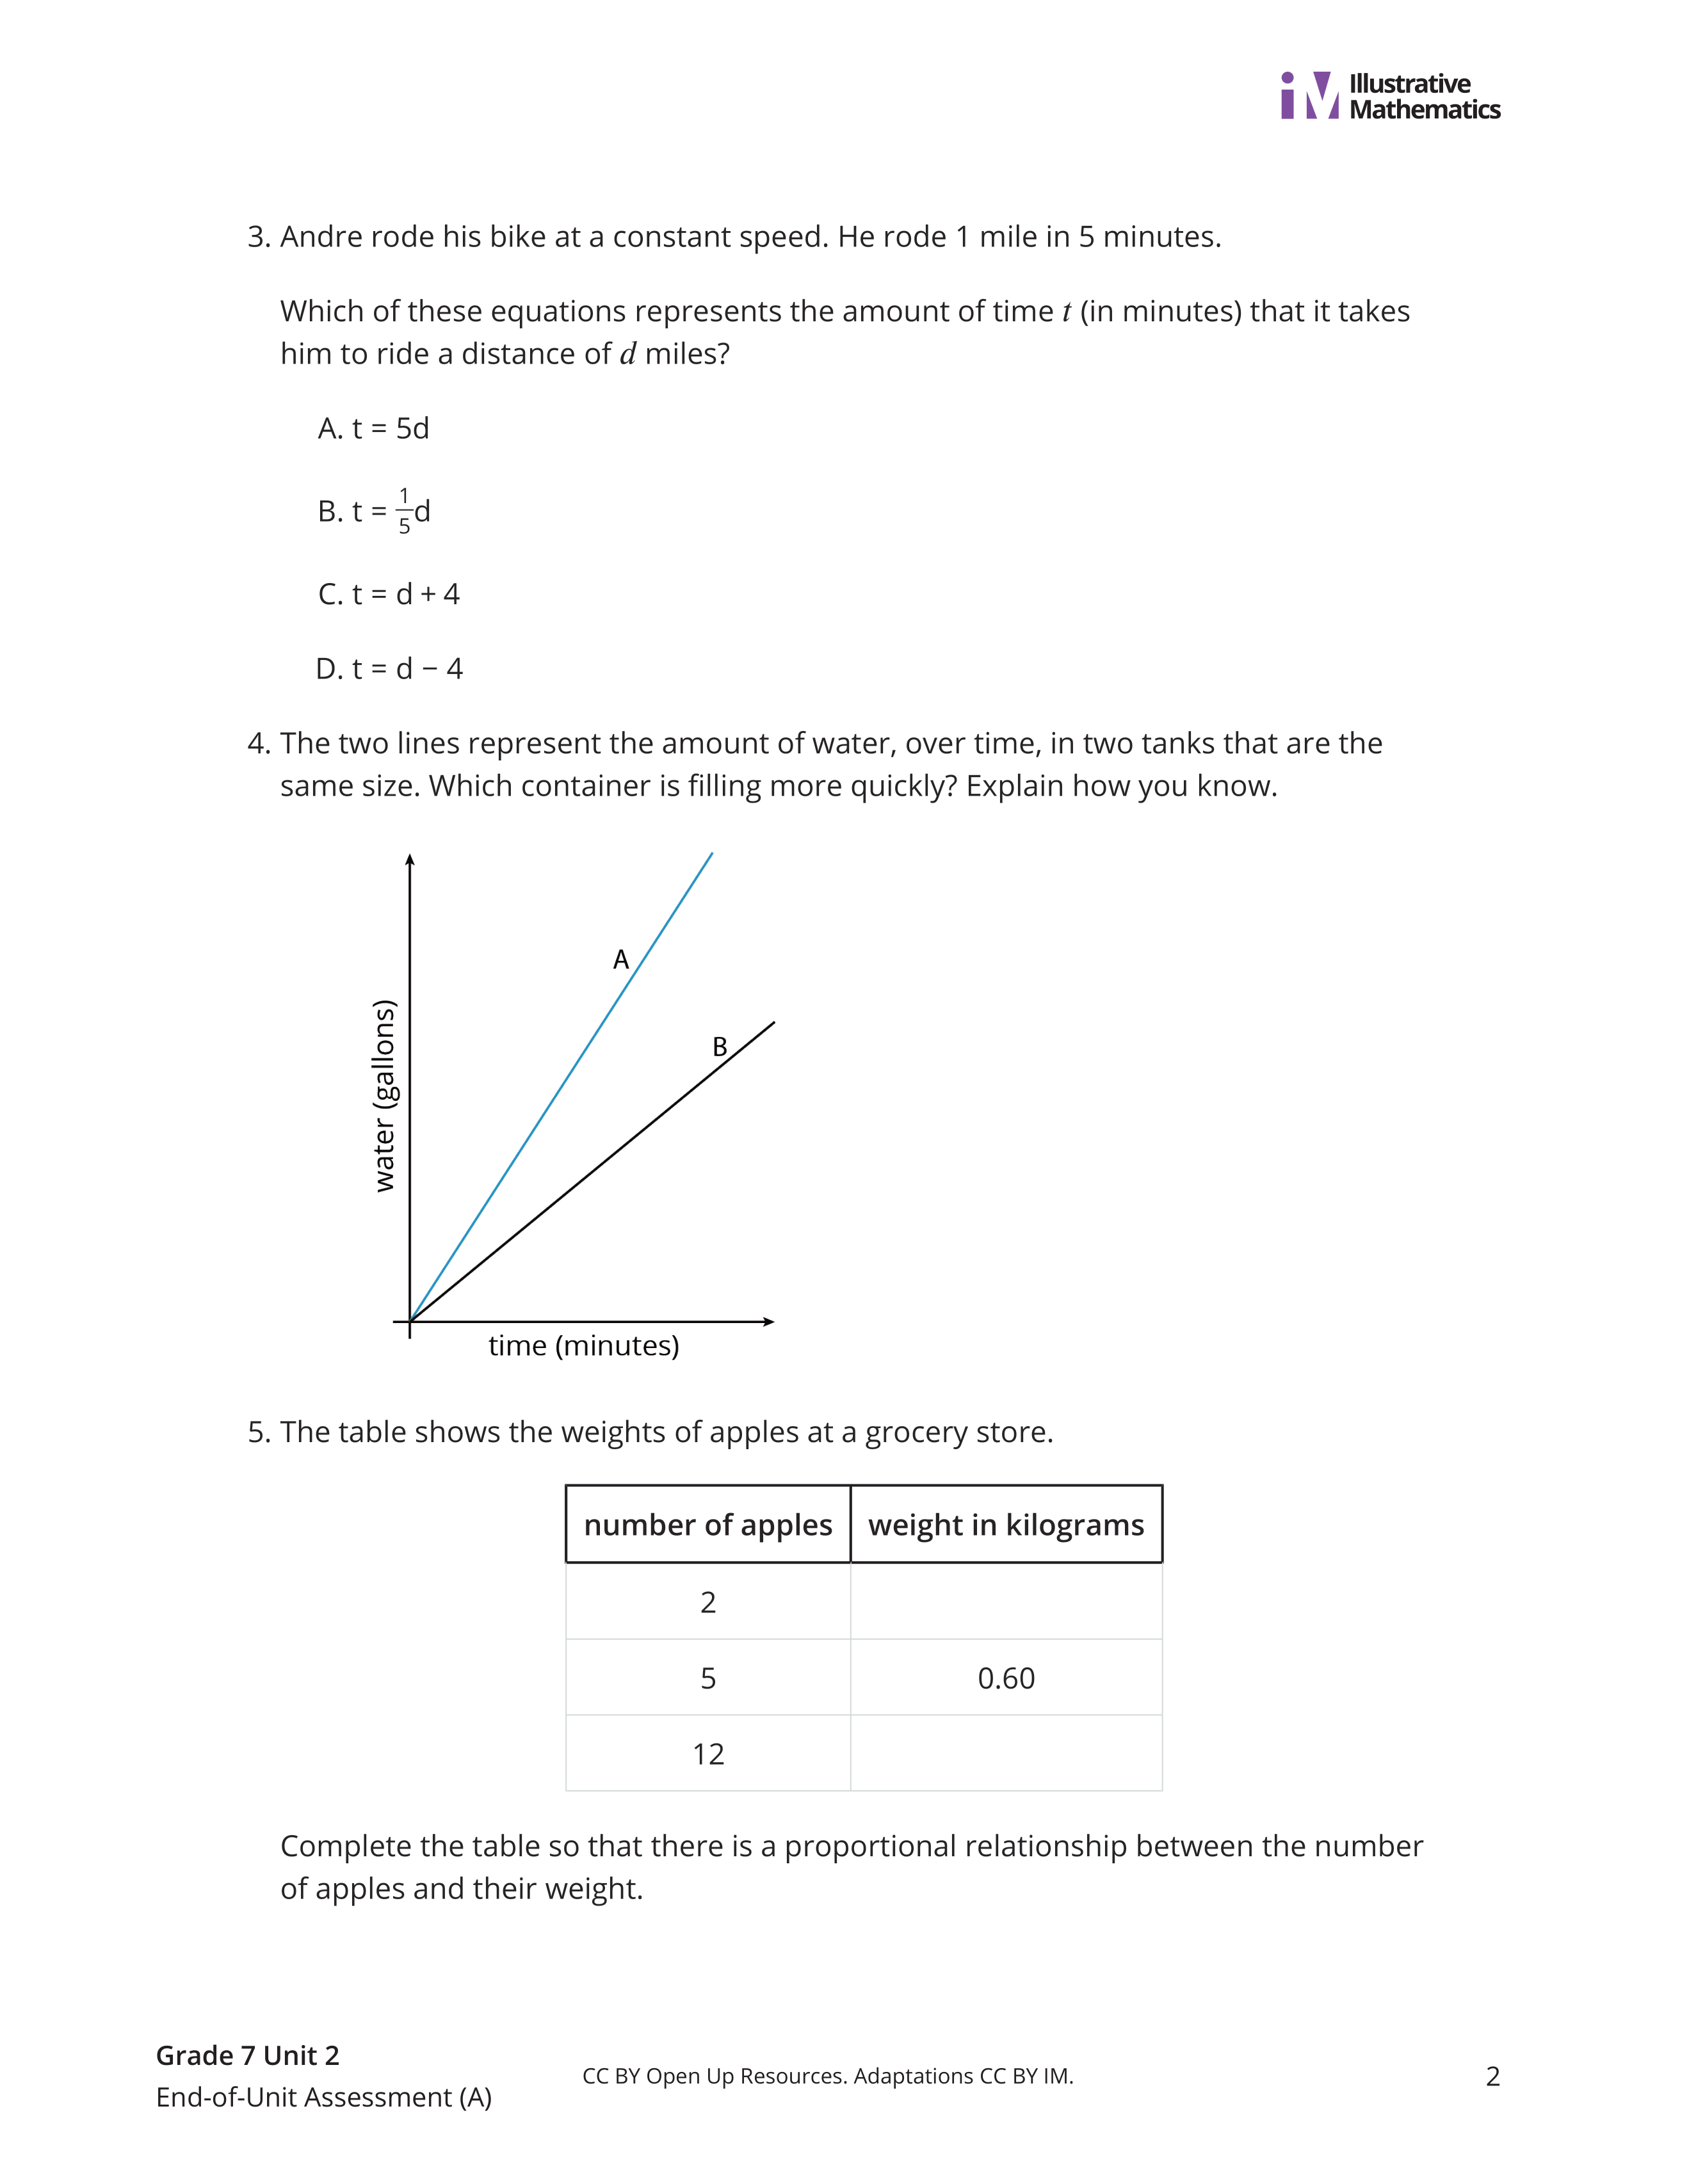
Andre rode his bike at a constant speed. He rode 1 mile in 5 minutes.
Which of these equations represents the amount of time t (in minutes) that it takes him to ride a distance of d miles? SHOW YOUR WORK!
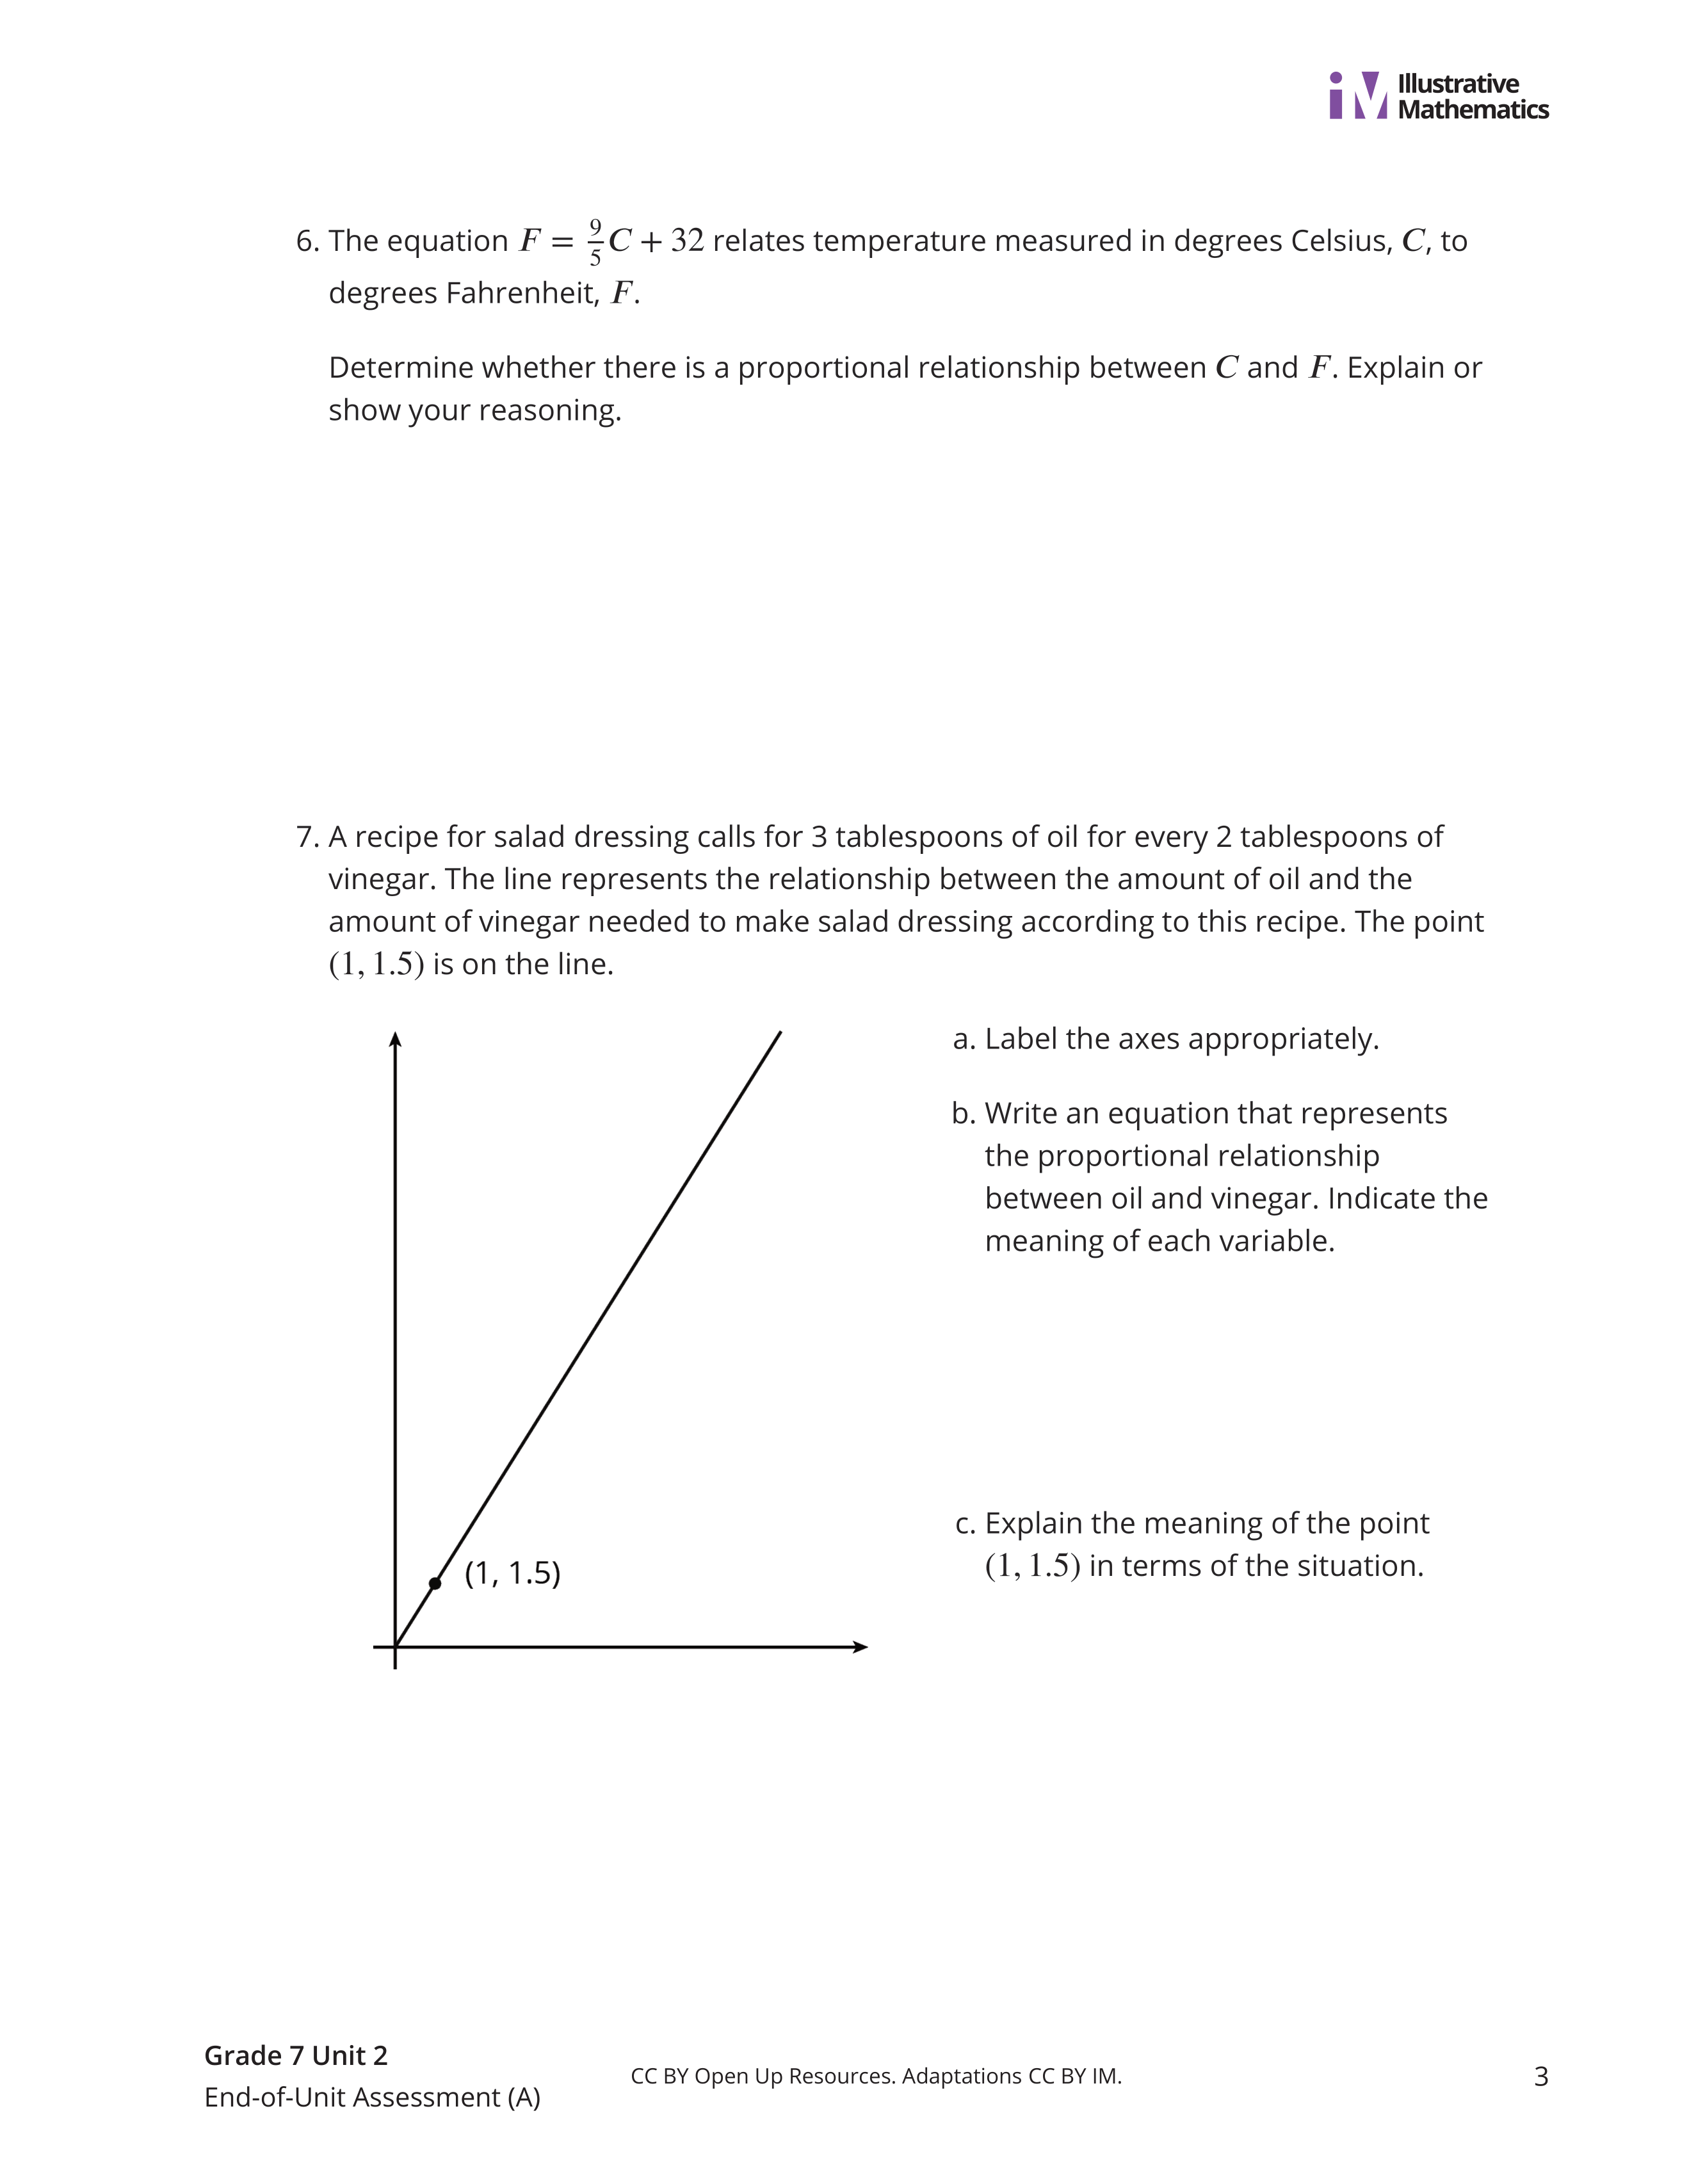
There is a proportional relationhip between C and F. EXPLAIN or SHOW YOUR REASONING.
The two lines represent the amount of water, over time, in two tanks that are the same size. Which container is filing more quickly? EXPLAIN how you know.
Complete the table so there is a proportional relationship between the number of apples and their weight.
Label the axes appropriately.
Write an equation that represents the proportional relationship between oil and vinegar. Indicate the meaning of each variable.
Explain the meaning of the point (1, 1.5) in terms of the situation.