Graphing Practice
star
star
star
star
star
Last updated almost 6 years ago
2 Nsɛmmisa
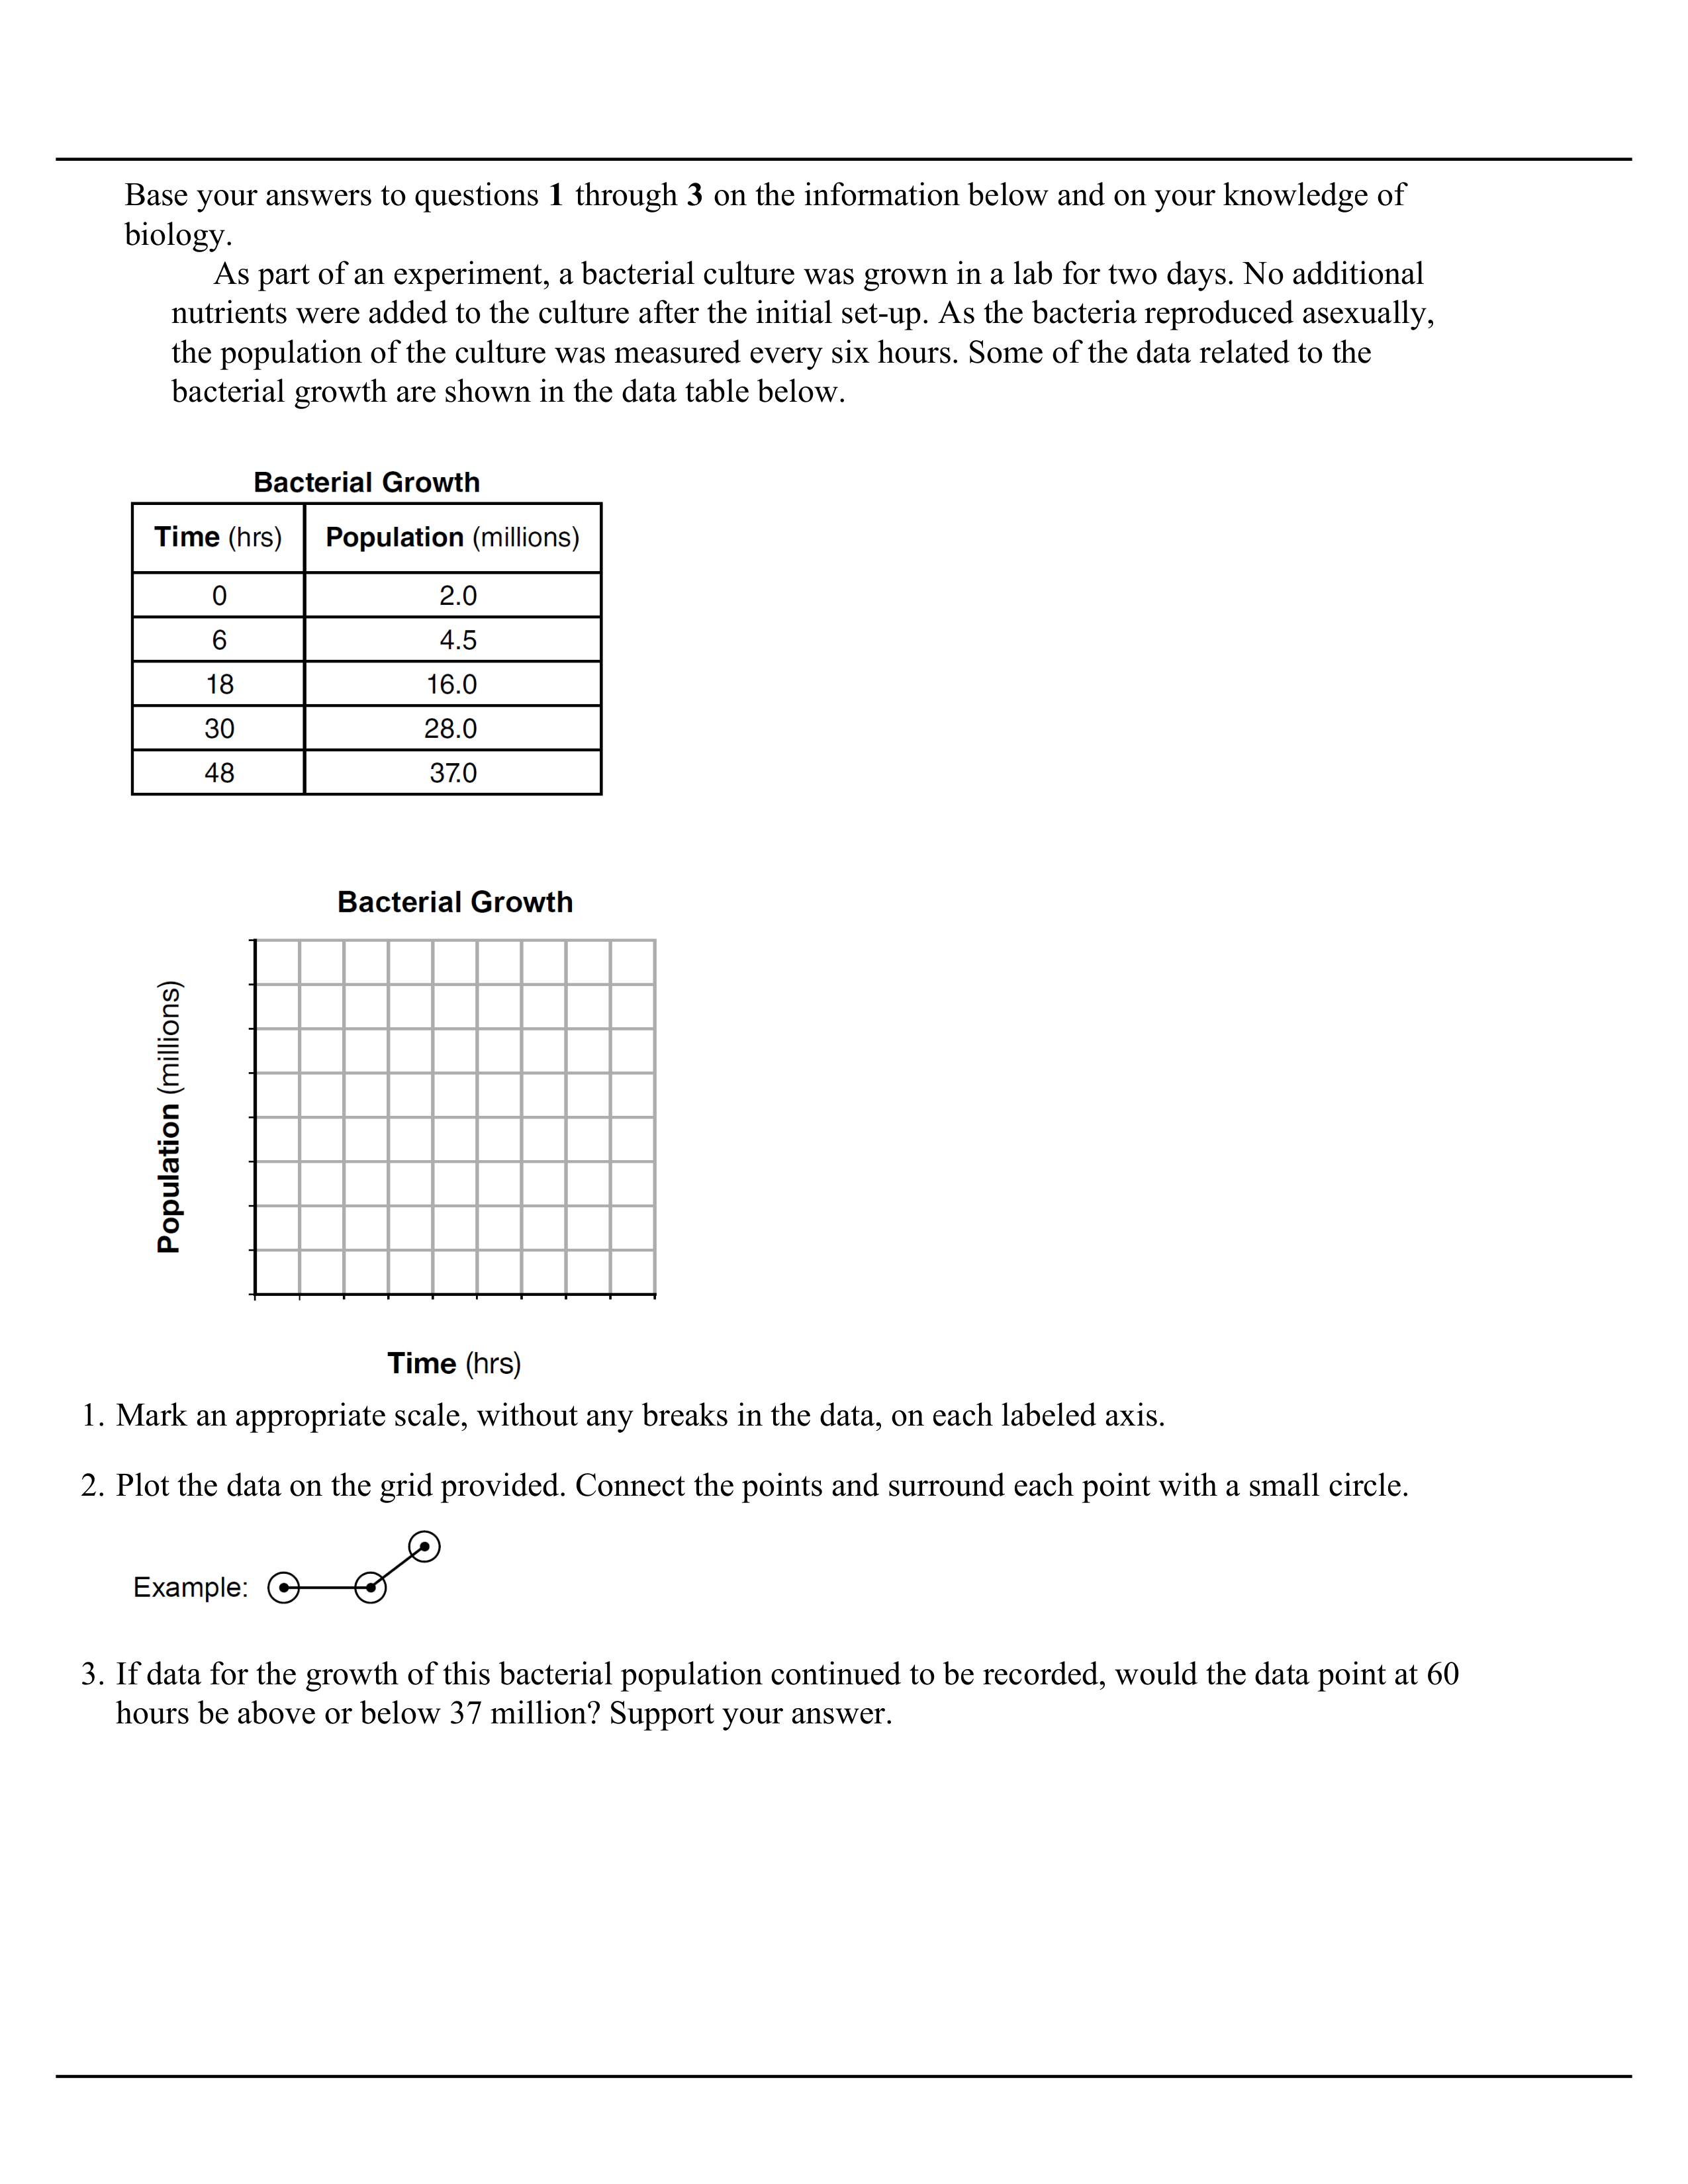
Use the Data table to complete the graph. Mark an appropriate scale on each labeled axis and Plot the data. Connect the points and surround each point with a small circle.

Don't forget to support your answer.