Log in
Sign up for FREE
arrow_back
Library

Covid -19 Assessment

star
star
star
star
star
Last updated over 5 years ago
24 questions
1
1
1
1
1
1
1
1
1
1
1
1
1
1
1
1
1
1
1
1
1
1
1
1
Read the information below and answer questions 1 through 4.
A hospital in Vienna noted that many of their female patients were dying of childbed fever after they had given birth in the hospital. The rates of this fever were much higher in the hospital than they were for women who had given birth at a different clinic. In fact, 10% of the women at the hospital contracted fever compared to 4% at the clinic.
Ignatz Semmelweiss was a doctor at the clinic and he felt that the fever was being transmitted on the hands of the doctors when they went from the morgue to examine the woman. He asked the doctors to wash their hands. After hand washing was required, the number of cases of childbed fever were reduced. He also noted that a doctor contracted the same fever after he cut himself with a scalpel that had been used after an autopsy. Semmelweis concluded that the fever was caused by some element that could be transferred from person to person.
Question 1
1.

Question 2
2.

Question 3
3.

Question 4
4.

Use the information below to write a scientific argument about whether Covid-19 is just like the flu in Questions 5-8.

COVID-19 Fact vs. Fiction

Debunking Myths About Coronavirus

With so much information circling about coronavirus (COVID-19), it’s hard to know what to believe and what are myths that are simply untrue and have no evidence to support them. We spoke with Infectious Disease Specialist Farida Malik, MD, to clear up some of the false information that has unfortunately spread through the internet, social media and other sources.  Dr. Malik shared her responses to address these myths by providing facts from expert sources, such as the Centers for Disease Control and Prevention (CDC), World Health Organization (WHO), and trusted medical journals.
MYTH: COVID-19 is no worse than seasonal flu.
FACTS:

Question 5
5.

Question 6
6.

Question 7
7.

Question 8
8.

Question 9
9.

Question 10
10.

Question 11
11.

Question 12
12.

Question 13
13.

Question 14
14.

Use the graph of death rates from the Spanish Flu below to answer questions 16-18.
Question 15
15.

Question 16
16.

Question 17
17.

The above image shows the number of deaths per 1000 people in the United Kingdom from the Spanish Flu during the pandemic of 1918-1919.
Question 18
18.

Question 19
19.

Question 20
20.

Question 21
21.

Question 22
22.

Question 23
23.

Question 24
24.

What is the scientific question that the doctor was researching?
10% of the women at the hospital contracted fever compared to 4% at the clinic.
Did female patients die of childbed fever after they had given birth in the hospital?
Was the childbed fever caused by some element that could be transferred from person to person?
After hand washing was required, the number of cases of childbed fever were reduced.
What is the claim or answer to the question?
10% of the women at the hospital contracted fever compared to 4% at the clinic.
Many of their female patients were dying of childbed fever after they had given birth in the hospital.
The fever was caused by some element that could be transferred from person to person.
After hand washing was required, the number of cases of childbed fever were reduced.
What is the evidence that supports the claim? Select two.
A doctor contracted the same fever after he cut himself with a scalpel that had been used after an autopsy.
Many of their female patients were dying of childbed fever after they had given birth in the hospital.
The fever was caused by some element that could be transferred from person to person.
After hand washing was required, the number of cases of childbed fever were reduced.
What is the reasoning? Explain why the evidence supports the claim.
If childbed fever is something that could be transferred from person to person, then...
the number of women in both clinics who got the fever would be the same.
the number of women before and after handwashing was required would be the same.
doctors who worked in the morge would not get a fever.
patients treated by the doctors who wash their hands would not get the fever.
What sources are used for the above information? Check all that apply.
Centers for Disease Control and Prevention (CDC)
World Health Organization (WHO)
a .org website
Infectious Disease Specialist Farida Malik, MD
social media
What is the question the article is addressing?
Is the information presented from a reliable source?
Covid-19 is worse than the seasonal flu.
Is Covid-19 worse than the seasonal flu?
The mortality rate of Covid -19 is between 0.4 and 1.5%
What is the claim of the article? What is the answer to the question?
Is the information presented from a reliable source?
Covid-19 is worse than the seasonal flu.
Is Covid-19 worse than the seasonal flu?
Covid-19 is not as severe as the seasonal flu.
What evidence does the article use to support the claim? Select three.
The reproduction number is lower for covid 19.
COVID-19 has a (R0) that is 2 to 2.5, which means one person with COVID-19 goes on to infect two or two-and-a-half people as compared to an R0 of 1.3 for seasonal flu
The mortality rate is anywhere from 4 to 15 times higher than the seasonal flu which has a mortality rate estimated at 0.1%.
There is no vaccine for Covid 19 and seasonal flu has one.
Covid-19 is not as severe as the seasonal flu.
Which of the following is the best scientific reasoning for how the evidence supports the claim that Covid-19 is worse than the seasonal flu?
There is currently no vaccine for Covid-19 and there is a vaccine for the seasonal flu.
COVID-19 has a (R0) that is 2 to 2.5, which means one person with COVID-19 goes on to infect two or two-and-a-half people as compared to an R0 of 1.3 for seasonal flu. The mortality rate is anywhere from 4 to 15 times higher than the seasonal flu which has a mortality rate estimated at 0.1%.
If the flu is worse than Covid-19, then then its mortality rate and reproduction number would be the same or lower than the flu.
If Covid-19 was not worse than the flu, then its mortality rate and reproduction number would be the same or lower than the flu.
The common cold and Sars-Cov-2 are
equally deadly.
equally contagious.
equally deadly and contagious.
neither deadly or contagious.
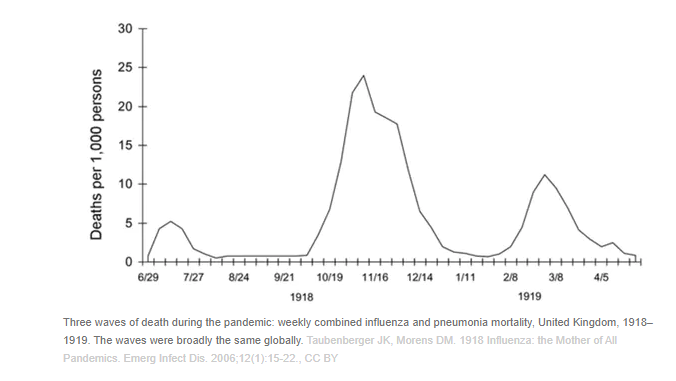
The Spanish Flu of 1918 infected 500 million people or one-third of the world’s population. The number of deaths was estimated to be at least 50 million worldwide with about 675,000 occurring in the United States. How does the Spanish Flu compare to Sars-Cov-2?
Spanish flu was less deadly than Sars-Cov-2.
Spanish flu is less contagious than Sars-Cov-2.
Spanish flu was more contagious and more deadly than Sars-Cov-2.
Spanish flu are Sars-Cov-2 are equally contagious and equally deadly.
How does media affect our perception of disease? Check all that apply.
Media may distort the actual risk of a disease by over reporting or hyping the disease.
Media can under cover a disease and as a result, the public may be unaware of how severe the disease is.
Media does not report on diseases.
Media covers diseases that are deadly or are contangious to make the public aware of the risks.
Smallpox was a disease that left survivors blinded and scarred as a result of a severe rash. Which statement about smallpox is true?
5 out of 100 people with smallpox would die.
If one person was infected with smallpox, they could infect 30 others.
Smallpox currently affects 1.2 million people a year.
The smallpox vaccine was the first vaccine given to prevent disease. It led to the eradication of the disease.
What is the relationship between disease deadliness and contagiousness?
The more deadly a disease is, the more contagious.
The more contagious, the less deadly the disease.
There is not relationship between deadliness and contagiousness.
The less deadly a disease is, the less contagious.
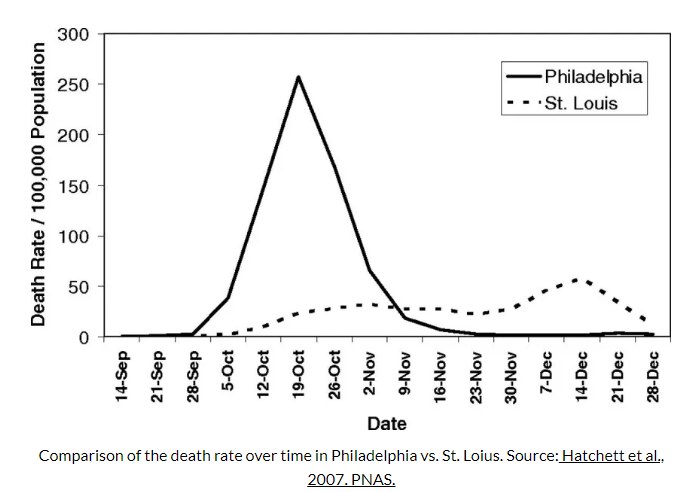
Which statement describes the line representing Philadelphia in the graph above?
The death rates in Philadelphia remained unchanged from Sept 14th through Dec 28th.
The death rates in Philadelphia rose sharply and stayed high from Oct 5th through Dec 28th.
The death rates in Philadelphia remained less than 50 per 100,000 from Sept 14th to Dec 28th.
The death rates in Philadelphia rose sharply to 250 deaths per 100,000 in Oct, then dropped sharply.
Which statement describes the line representing St. Louis in the graph above?
The death rates in St. Louis remained unchanged from Sept 14th through Dec 28th.
The death rates in St. Louis rose sharply and stayed high from Oct 5th through Dec 28th.
The death rates in St. Louis remained less than 50 per 100,000 from Sept 14th to Dec 28th.
The death rates in St. Louis rose sharply to 250 deaths per 100,000 in Oct, then dropped sharply.
Which of the following caused the differences in the two cities' death rates?
Philadelphia had social distancing and closed schools and businesses while St. Louis held a large parade at the end of September.
St. Louis had social distancing and closed schools and businesses while Philadelphia held a large parade at the end of September.
Both Philadelphia and St. Louis held a large parade at the end of September that became super spreading events for the Spanish Flu.
Both Philadelphia and St. Louis had social distancing and closed schools and businesses to prevent the spread of the Spanish Fu.
Looking at the graph above, what trend in the data suggests that social distancing measures were relaxed?
There was a decrease in deaths during January.
There was a decrease in deaths during July and August
There was a decrease in deaths during November.
There was an increase in deaths in the month of March.
Using your background knowledge of seasonal flu, infer why the death rates decreased during August and September.
Social distancing measures were relaxed, decreasing the spread of Spanish Flu.
During the summer, people spend more time outdoors, therefore social distancing.
A vaccine was given to prevent infection of Spanish Flu.
People were spending more time indoors with family.
Which description below matches this step in the virus reproduction model?
The virus attaches to the host cell using a lock and key connection of molecules on their surfaces.
Virus enters the host cell.
Virus highjacks (takes over control) the host cell and forces it to make copies of more virus.
The viruses are released by the host cell and can attach to new host cells.
Which description below matches this step in the virus reproduction model?
The virus attaches to the host cell using a lock and key connection of molecules on their surfaces.
Virus enters the host cell.
Virus highjacks (takes over control) of the host cell by replacing the genetic information (DNA/RNA).
The viruses are released by the host cell and can attach to new host cells.
Based on the table below, what is a possible claim about the infection rate of the virus?
The infection rate became more rapid because there are more viral particles than what was originally introduced in the model.
The number of healthy cells decreased so rapidly because the amount of time to decrease the population by 10 increased.
The infection rate became slowed because there are more viral particles than what was originally introduced in the model.
Based on the data, which of the following is the best scientific explanation for the viral infection rate?
The number of viruses increases with time, thus allowing the rate of infection to increase. However, the rate of infection increases when there are no more healthy cells to infect.
The number of viruses increases with time, thus allowing the rate of infection to increase. However, the rate of infection tapers off when there are no more healthy cells to infect.
The number of viruses increases with time, thus allowing the rate of infection to decrease. However, the rate of infection tapers off when there are no more healthy cells to infect.
The number of viruses decreases with time, thus allowing the rate of infection to increase. However, the rate of infection tapers off when there are no more healthy cells to infect.