Log in
Sign up for FREE
arrow_back
Library

6.6.A.05 -Describing a Distribution Displayed in a Histogram – Exit Ticket

star
star
star
star
star
Last updated about 4 years ago
3 questions
Calculators are allowed for completing your problems. Hector’s mom had a rummage sale, and after she sold an item, she tallied for how much money she sold the item. Following is the frequency table Hector’s mom created:
10
Question 1
1.

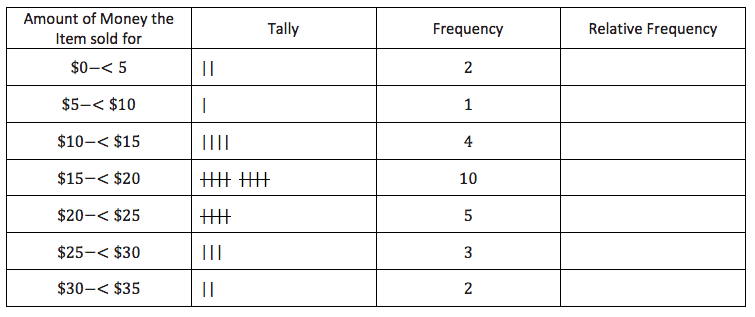
What was the total number of items sold at the rummage sale?

10
10
From EngageNY.org of the New York State Education Department. Grade 6 Mathematics Module 6, Topic A, Lesson 1. Internet. Available from https://www.engageny.org/resource/grade-6-mathemat...; accessed 03/Feb/2016.
Question 2
2.

Complete the relative frequency column. Round to the nearest thousandth.

Question 3
3.

What percent of the items Hector’s mom sold was sold for $