7.5.C.19 - Understanding Variability When Estimating a Population Proportion – Exit Ticket
star
star
star
star
star
Last updated almost 4 years ago
3 questions
10
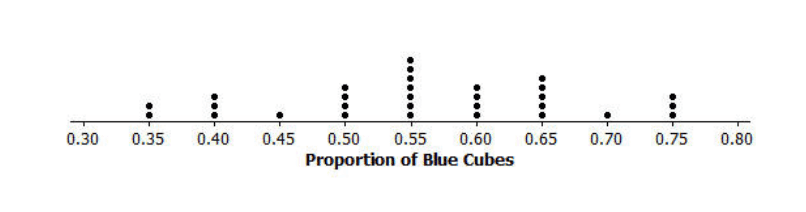
Describe the shape of the distribution.
10
Describe the variability of the distribution.
10
Predict how the dot plot would look differently if the sample sizes had been 40
instead of 20.
Predict how the dot plot would look differently if the sample sizes had been 40
instead of 20.
