Grade 7 Mathematics 1.A.06- Exit Ticket
star
star
star
star
star
Posljednje ažuriranje over 4 years ago
3 questions

10
7.RP.2.a
10
7.RP.2.a
10
7.RP.2.a
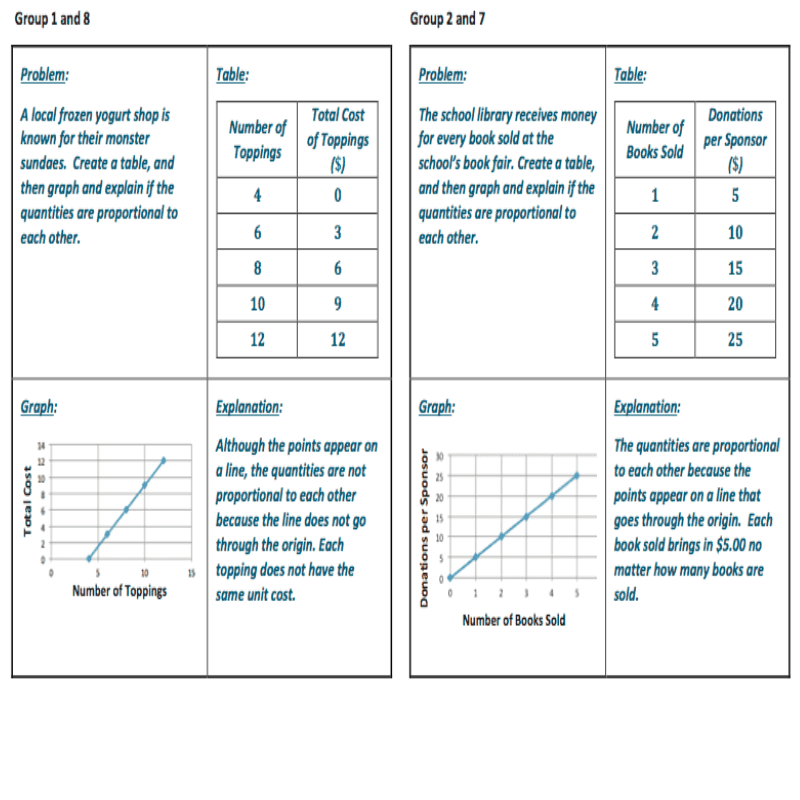
Which graphs in the gallery walk represented proportional relationships and which did not? List the group number.
What are the characteristics of the graphs that represent proportional relationships?
For the graphs representing proportional relationships, what does (0,0) mean in the context of the given situation?