Lesson 4 Extra Credit - Natural Disasters and Plate Tectonics
star
star
star
star
star
Posljednje ažuriranje over 5 years ago
27
1
1
1
1
1
1
1
1
1
1
1
1
1
1
1

1
1

1
1
1
1
1
1
1
1
1
1
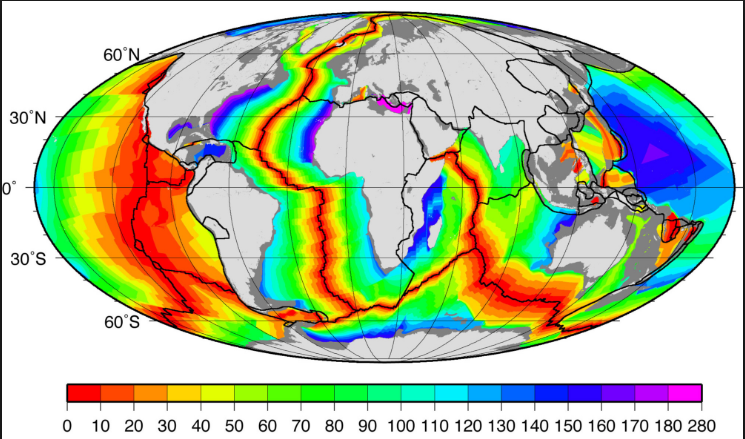
What type of plate boundary is located where the red is located on the map?
What is the unit of measurement for the key at the bottom of the map?
Why are the blue and pink colors located closest to the continents?
What information does this map tell us? Use at least 3-4 pieces of evidence.
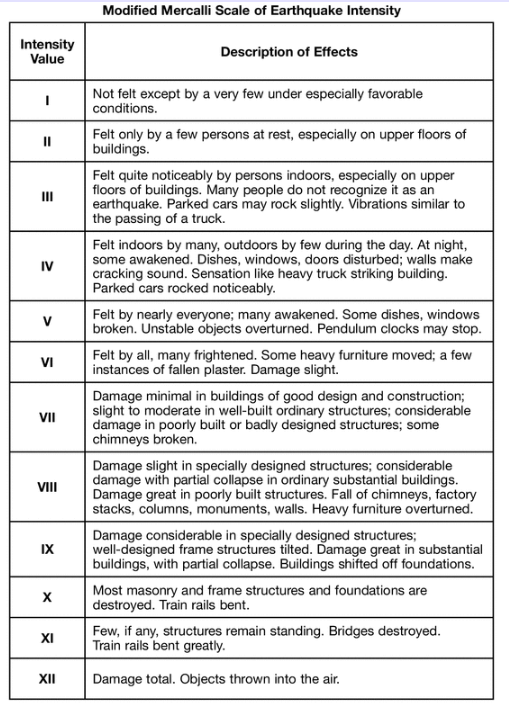
Read the Modified Mercalli Scale above. On the map in your answer booklet, a line has been drawn to separate regions with Mercalli values of V from regions with Mercalli values of VI. Using the touchscreen or your mouse Draw another line to separate regions with Mercalli values of VI from regions with Mercalli values of VII
The epicenter of this earthquake was located at 38° N 142° E. Identify the type of tectonic plate boundary and the name of the plates themselves that are located nearest to the epicenter of this earthquake.
Describe one way the P-waves and S-waves recorded on seismograms at Ishinomaki and Nagano were used to indicate that Ishinomaki was closer to the earthquake epicenter than was Nagano.

A 25-foot high tsunami hit the Japanese city of Ishinomaki. Describe 2-3 precautions the city could take now to protect citizens from tsunamis in future years. You can research using the internet to answer this question.
What are they predicting would be the cause for this megatsunami? Be specific using multiple forms of evidence.
What areas of the world will be affected? What kind of damage will it cause.
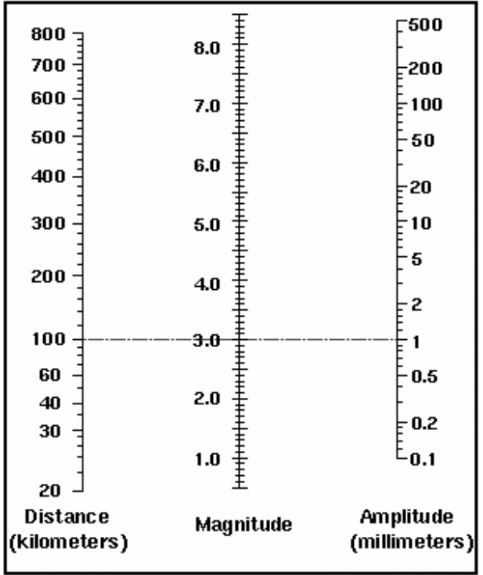
How big was that quake? The Richter scale is used to determine how powerful a quake is. Similar to stars, the intensity to the observer is dependent on distance from the quake. This chart is used to determine the quake’s strength. Place a point on the left side according to the quake’s distance. Place another point on the right side for the observed amplitude of shaking (use a seismogram reading). Last draw a line connecting the two points and the middle number is the Richter magnitude of the quake. For example a quake with an amplitude of 1mm that is 100 km away would have a magnitude of 3.0. Remember that an increase of 1.0 on the Richter scale is equal to 10 times the magnitude (and 32 times the amount of energy). So a quake that is a 6.0 on the Richter scale is 1000 times more powerful than our practice problem.
Your seismogram reading is showing 10mm and its distance is 500 km. What is the magnitude?
A 100mm amplitude reading that is only 30 km away would be what magnitude?
Graph the relationship between amplitude and distance
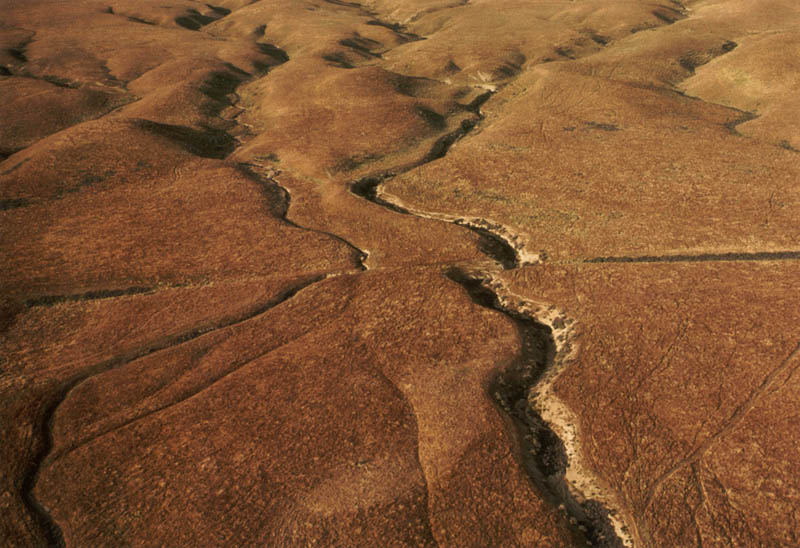
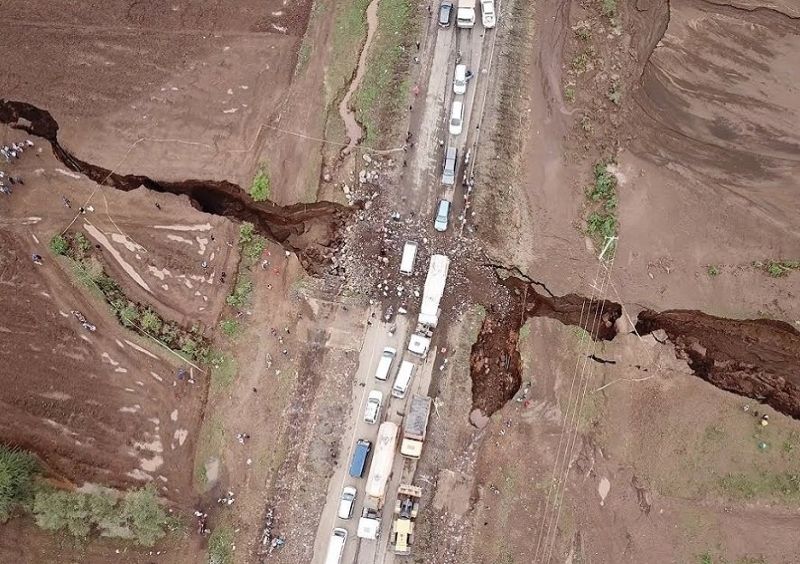
Describe what is happening in the image above using your knowledge of Earth Science. Where is a possible place that this might exist on Earth.
The crack shown above formed in Kenya is up to 50 feet deep and 65 feet wide significantly damaged a major road and destroyed homes. It formed in a different way than the crack above. What processes caused this to happen? Be specific including plates names, boundary types, etc.
Describe how you think this earthquake happened using your knowledge of Earth Science and the ESRT. Be specific including plates names, boundary types, etc.
Why was this earthquake , a 7.0 magnitude, more damaging than other earthquakes that were stronger?
Describe how you think the strongest earthquake ever recorded happened using your knowledge of Earth Science and the ESRT. Be specific including plates names, boundary types, etc.
In what ways was this earthquake different than the Haiti Earthquake? Use as many pieces of evidence as possible.
Go to this link: Earthquakes in U.S. which shows all Earthquakes of Magnitude 2.5 or greater within the last weekk to to answer the following questions.
Why are there earthquakes happening in the center of the United States, considering there are no plate boundaries anywhere near them. You will have to research to find the answer.
Where is the second most active fault line in the U.S. located?
When did the last big earthquake happen there? Describe the effects of this earthquake?
Why did these earthquakes occur in the middle of continents, nowhere near a plate boundary?
Why is quiet along an active fault considered a problem?
You are about to move to inland area that is prone to Earthquakes. What are 3-4 things you can do to prepare for Earthquakes before they actually happen?
The image below shows the Cascade Volcano Range which is located in the Western U.S.

What processes are involved in creating the volcanos shown above. Be specific including plates names, boundary types, etc.
Mt. Hood is located very close to the city of Portland, Oregon and has a history of eruptions. What are 2-3 precautions that Portland residents could take to prepare for a volcanic eruption?