Chapter 2 AP Stats Test
star
star
star
star
star
Posljednje ažuriranje over 5 years ago
14
Napomena autora:
AP Statistics Chapter 1 Test
The Practice of Statistics, 4th edition resources
1
2
3
1
1
1
1
1
1
1
3
3
2
3
AP Statistics Chapter 1 Test
The Practice of Statistics, 4th edition resources
A smooth curve which approximates the shape of a histogram and describes the overall pattern of the distribution is called a
What are the two requirements of a Density Curve? Select ALL that apply.
A "Normal Density Curve" has which of the following properties? Select ALL that apply.
The "typical" value refers to:
The heights of American men aged 18 to 24 are approximately Normally distributed with a mean of 68 inches and a standard deviation of 2.5 inches. Only about 5% of young men have heights outside the range
Use the information in the previous problem. About what percentage of the men are over 70.5 inches tall?
(Use Table A) The area under the standard Normal curve corresponding to –0.3 < Z < 1.6 is
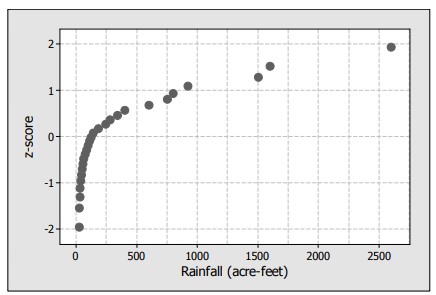
The graph above is a Normal probability plot for the amount of rainfall (in acre-feet) obtained from 26 randomly selected clouds that were seeded with silver oxide. Which of the following statements about the shape of the rainfall distribution is true?
Which of the following properties is true for all Normal density curves?
I. They are symmetric.
II. The curve reaches its peak at the mean.
III. 95% percent of the area under the curve is within one standard deviation of the mean.
A fire department in a rural county reports that its response time to fires is approximately Normally distributed with a mean of 22 minutes and a standard deviation of 11.9 minutes. Approximately what proportion of their response times is over 30 minutes?
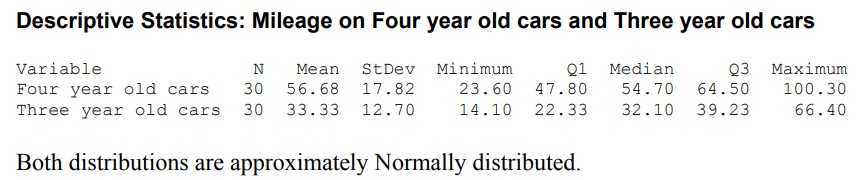
One car that Chris is interested in is four years old and has been driven 40 thousand miles. Another one is three years old and has 30 thousand miles on it. How does the number of miles on these cars compare, relative to other cars of the same age? Provide appropriate statistical calculations to support your answer.
Based on the information above, estimate the number of four year old cars Chris looked at that had been driven more than 42 thousand miles.
Estimate the 60th percentile for mileage on the cars Chris found that were four years old.
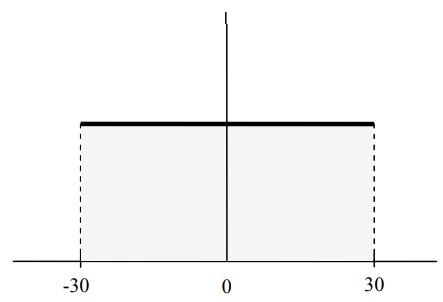
Old-fashioned mechanical alarm clocks were not very accurate about when the alarm went off. The density curve below describes the distribution of times a certain alarm clock went off. The scale on the x-axis represents when the alarm went off, in seconds, before (negative) or after (positive) the alarm was set to go off. What proportion of the time did the alarm go off within 10 seconds of the time it was set for?
Shade the appropriate area on the graph to show how you found the answer.