1
1
1
1
1
1
1
1
1
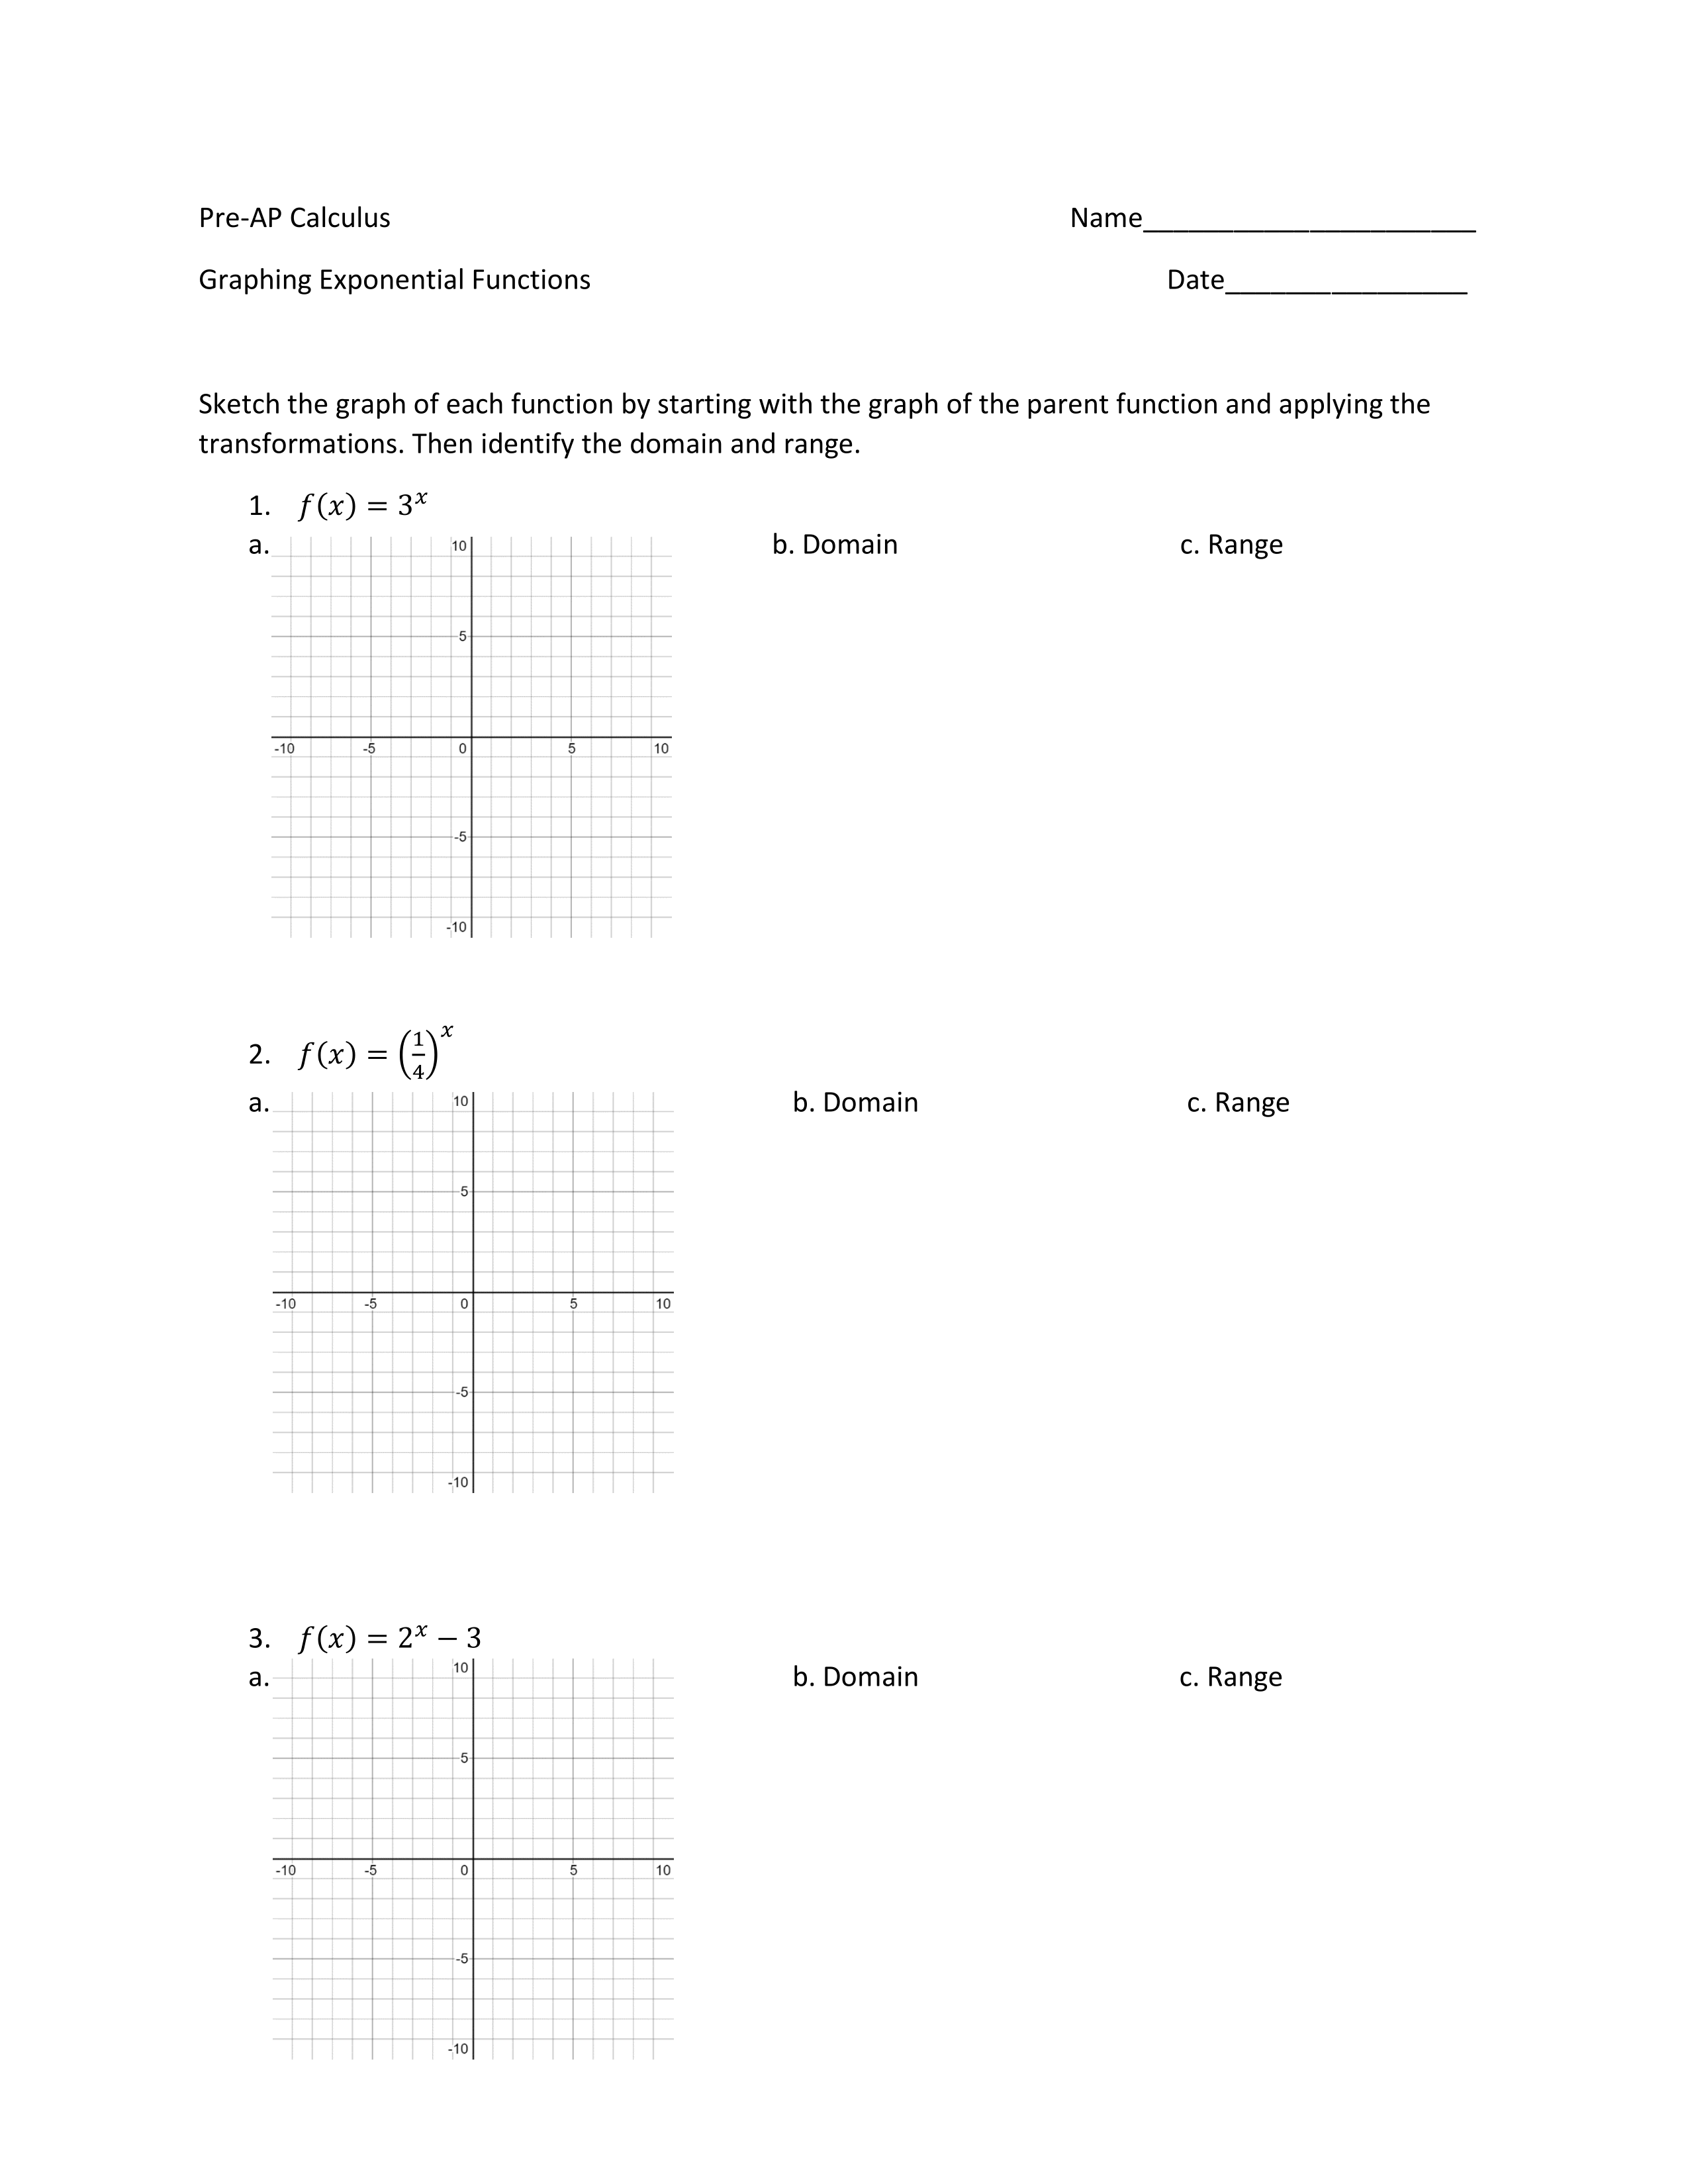
Sketch the graph below. Make sure that you include the horizontal asymptote.
Type your answer using interval notation.

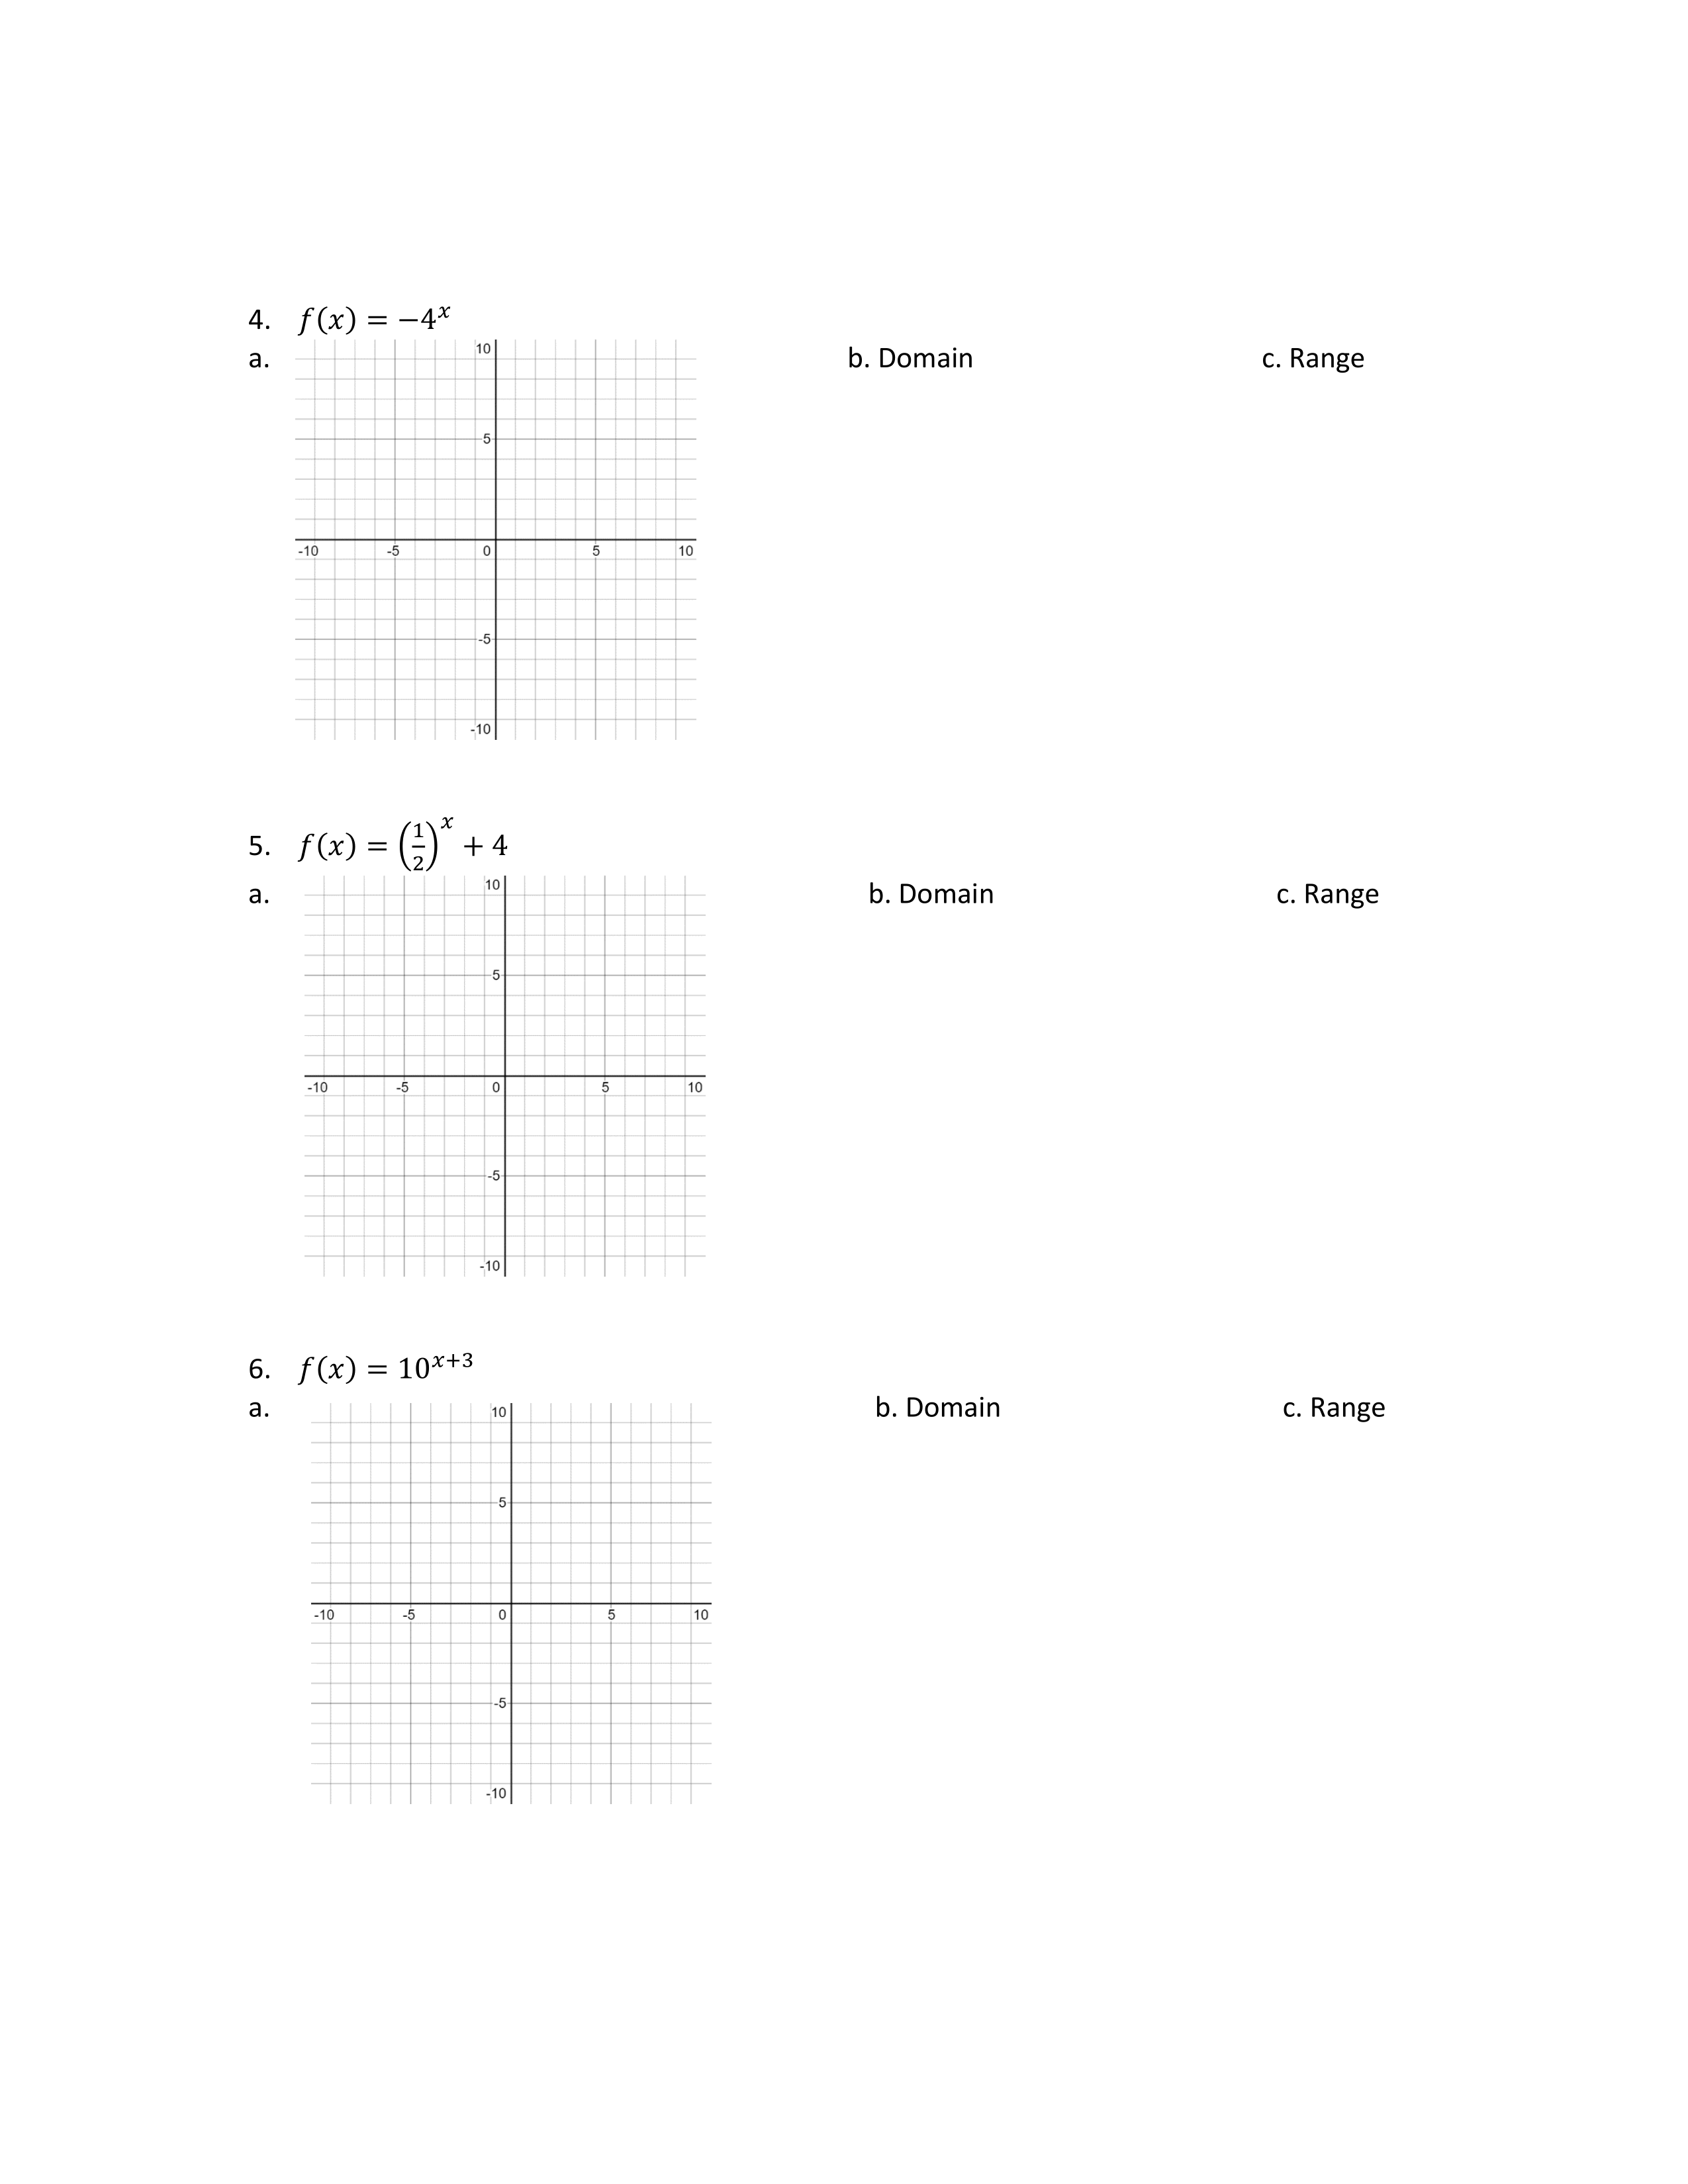
Sketch the graph below. Make sure that you include the horizontal asymptote.
Type your answer using interval notation.
Type your answer using interval notation.
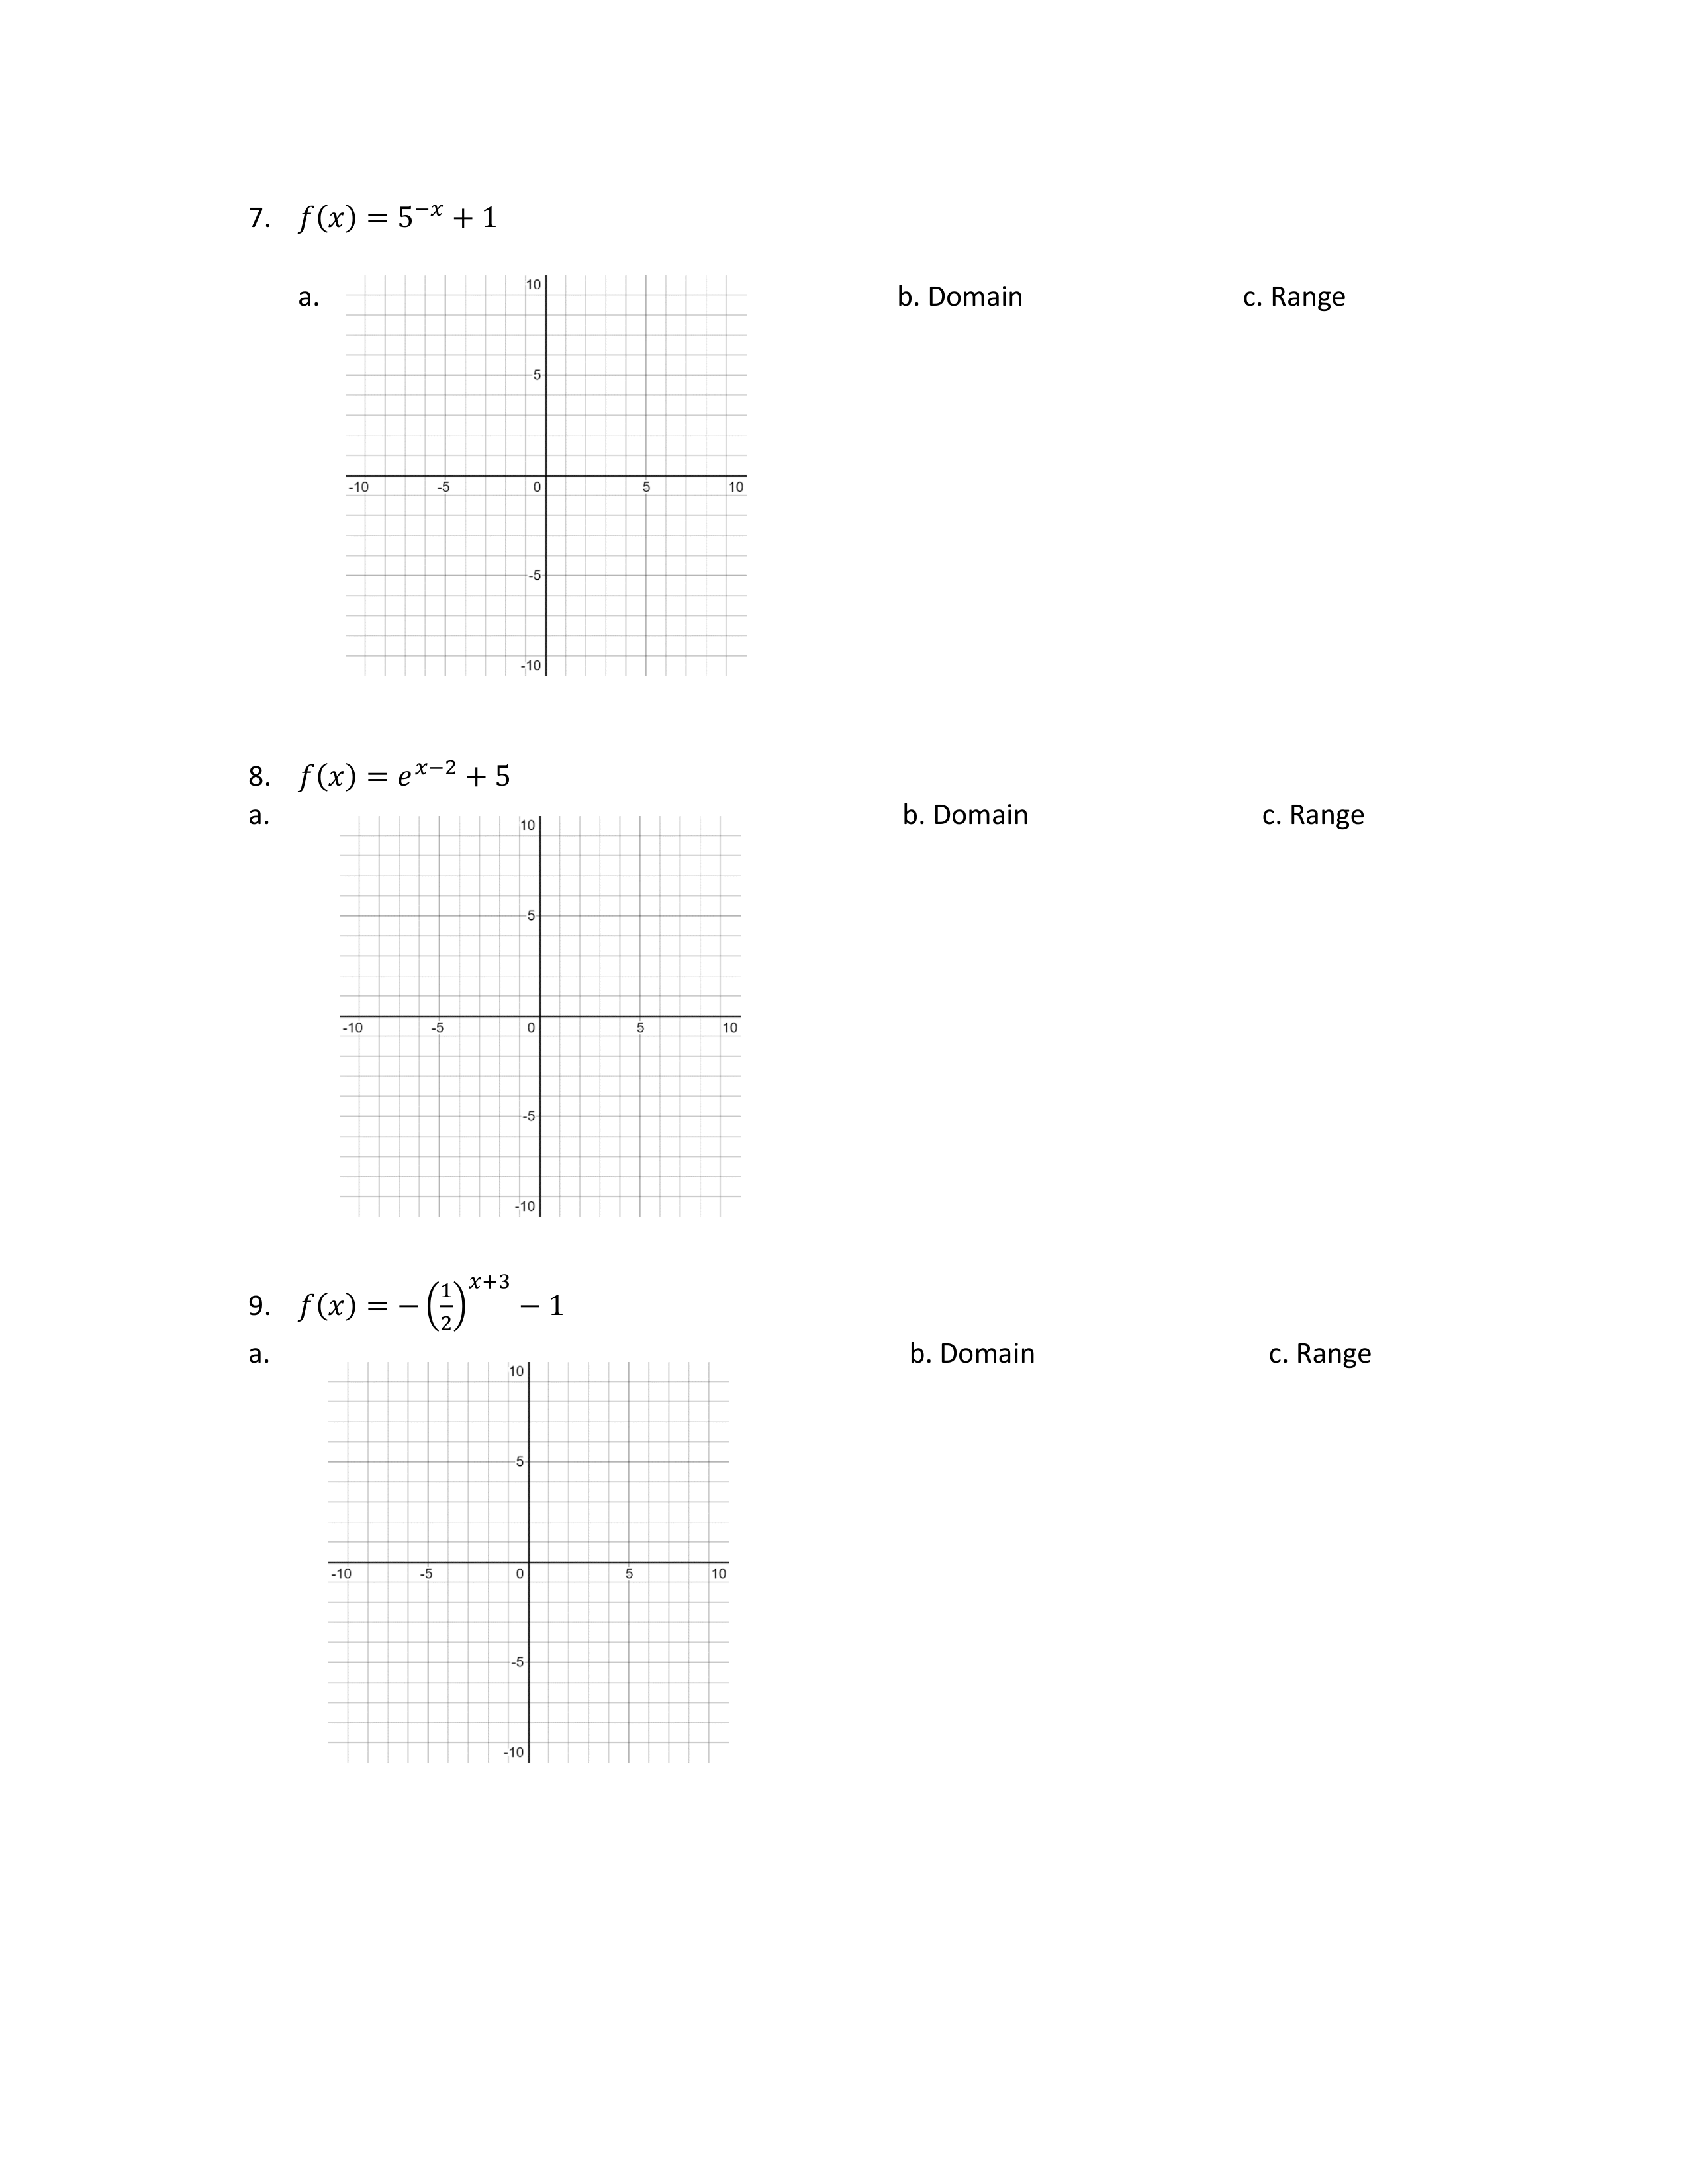
Sketch the graph below. Make sure that you include the horizontal asymptote.
Type your answer using interval notation.
Type your answer using interval notation.
Sketch the graph below. Make sure that you include the horizontal asymptote.
Type your answer using interval notation.
Type your answer using interval notation.
Sketch the graph below. Make sure that you include the horizontal asymptote.
Type your answer using interval notation.
Type your answer using interval notation.
Sketch the graph below. Make sure that you include the horizontal asymptote.
Type your answer using interval notation.
Type your answer using interval notation.
Sketch the graph below. Make sure that you include the horizontal asymptote.
Type your answer using interval notation.
Type your answer using interval notation.
Sketch the graph below. Make sure that you include the horizontal asymptote.
Type your answer using interval notation.
Type your answer using interval notation.
Sketch the graph below. Make sure that you include the horizontal asymptote.
Type your answer using interval notation.
Type your answer using interval notation.
Sketch the graph below. Make sure that you include the horizontal asymptote.
Type your answer using interval notation.
Type your answer using interval notation.
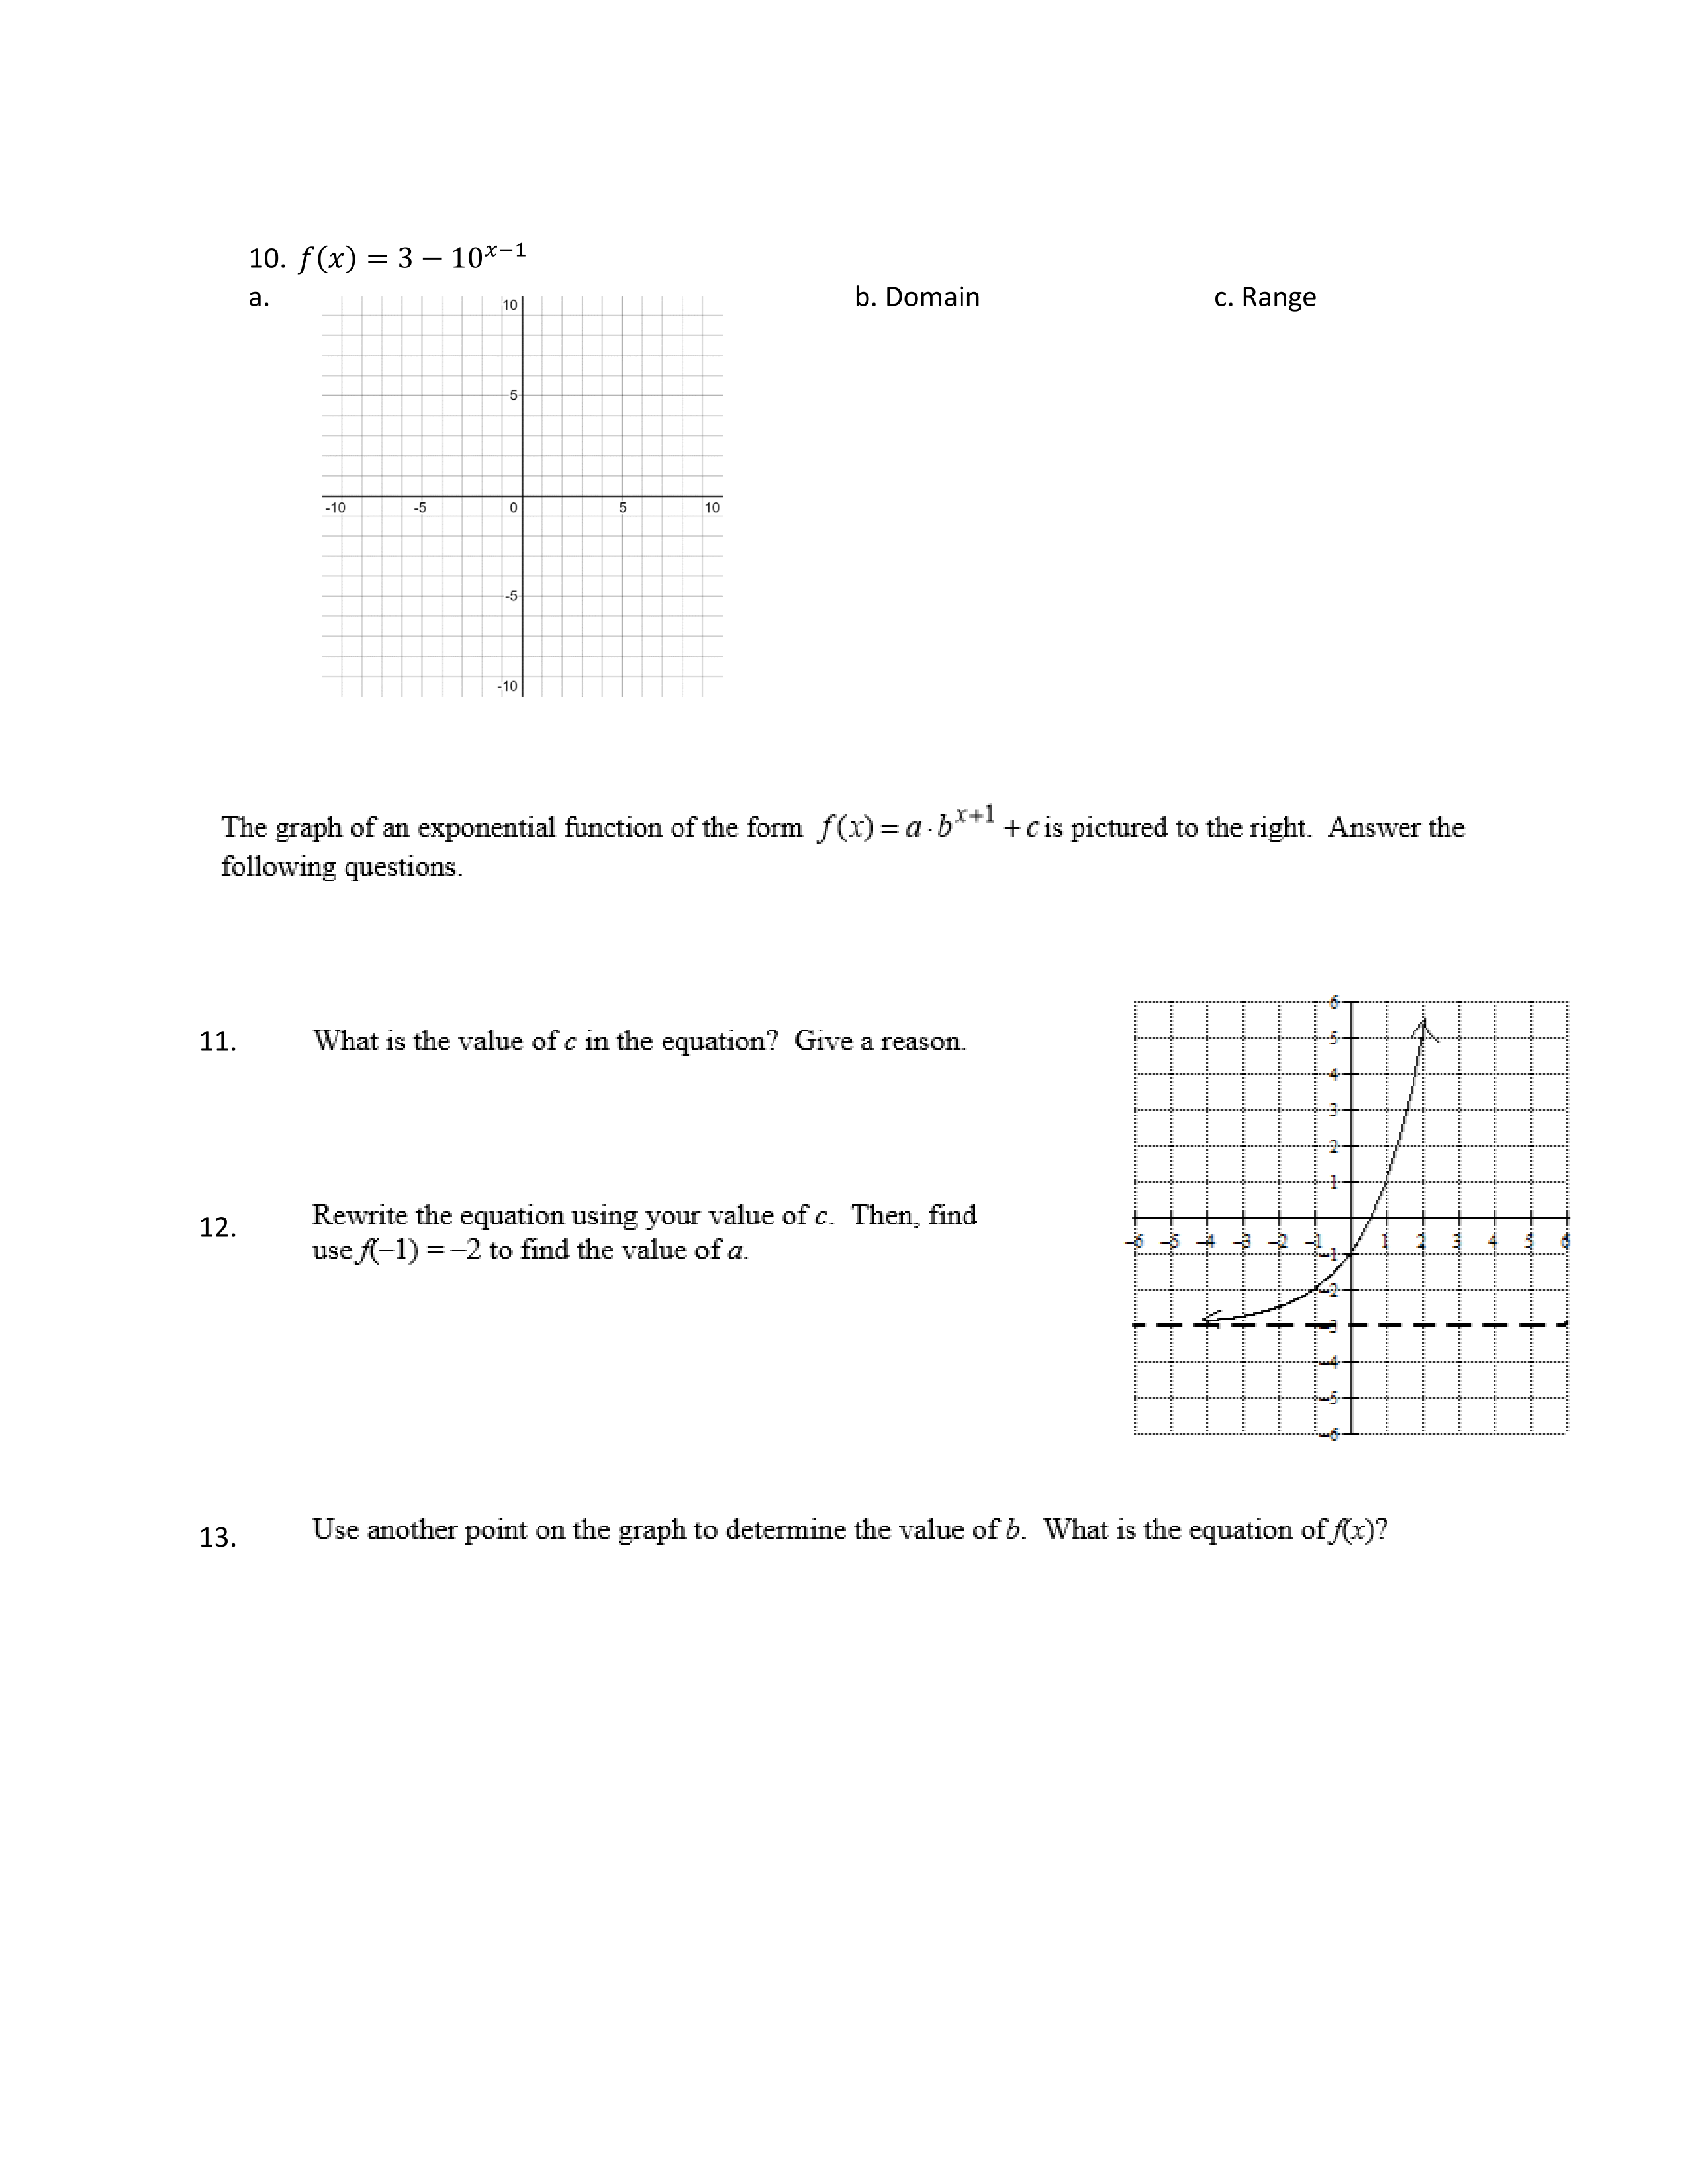
Type your answer using interval notation.
c =
a =
Type the equation for f(x).
a =
b =
c =
Type Growth or Decay.
a =
b =
c =
Type Growth or Decay.
a =
b =
c =