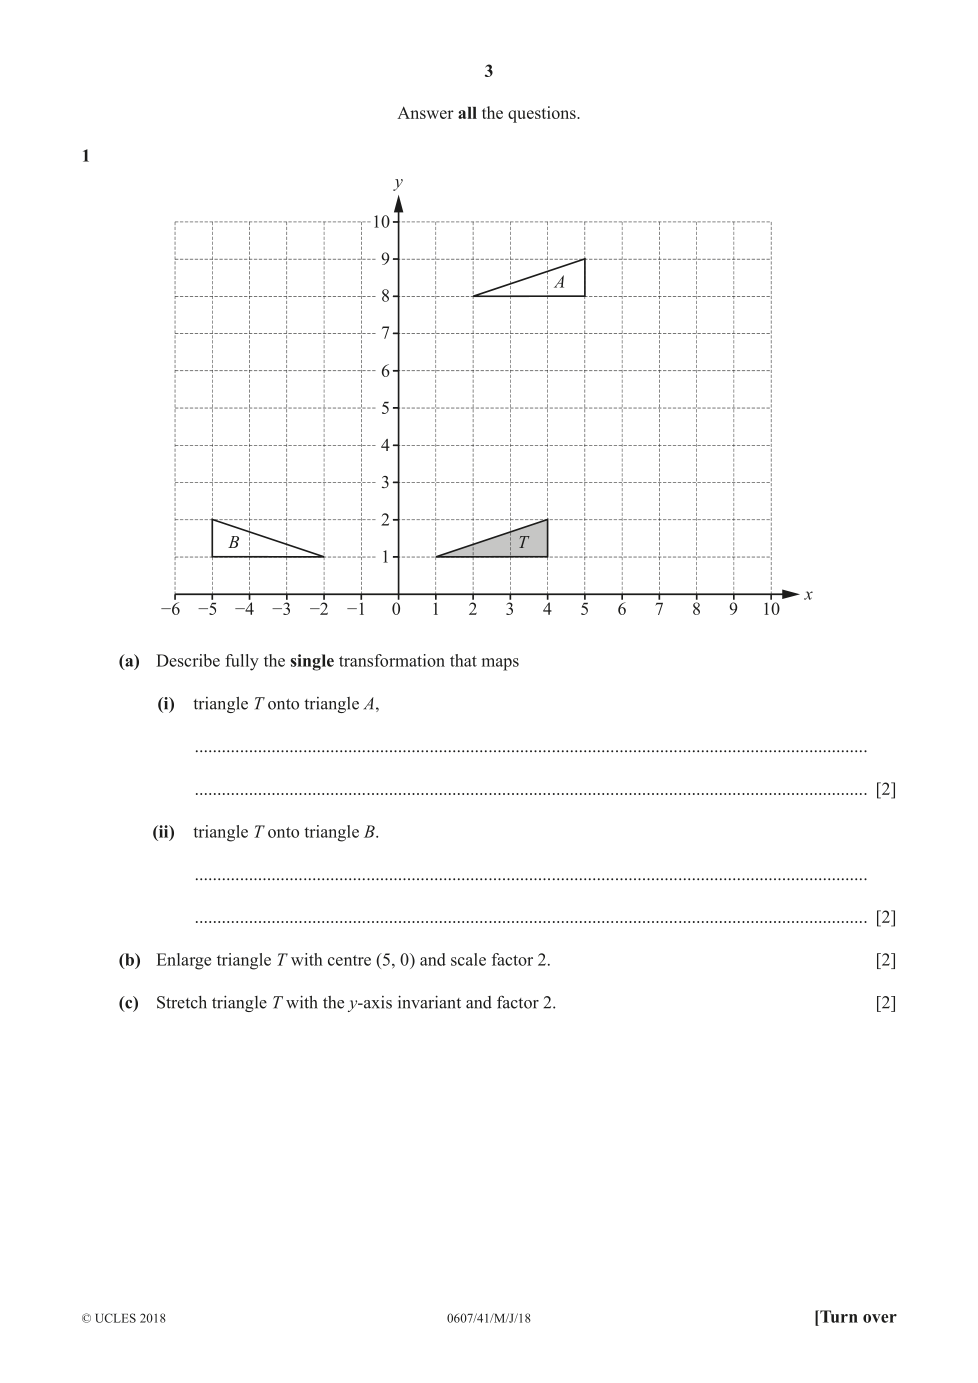
Enlarge triangle T with centre (5, 0) and scale factor 2.
Stretch triangle T with the y-axis invariant and factor 2.
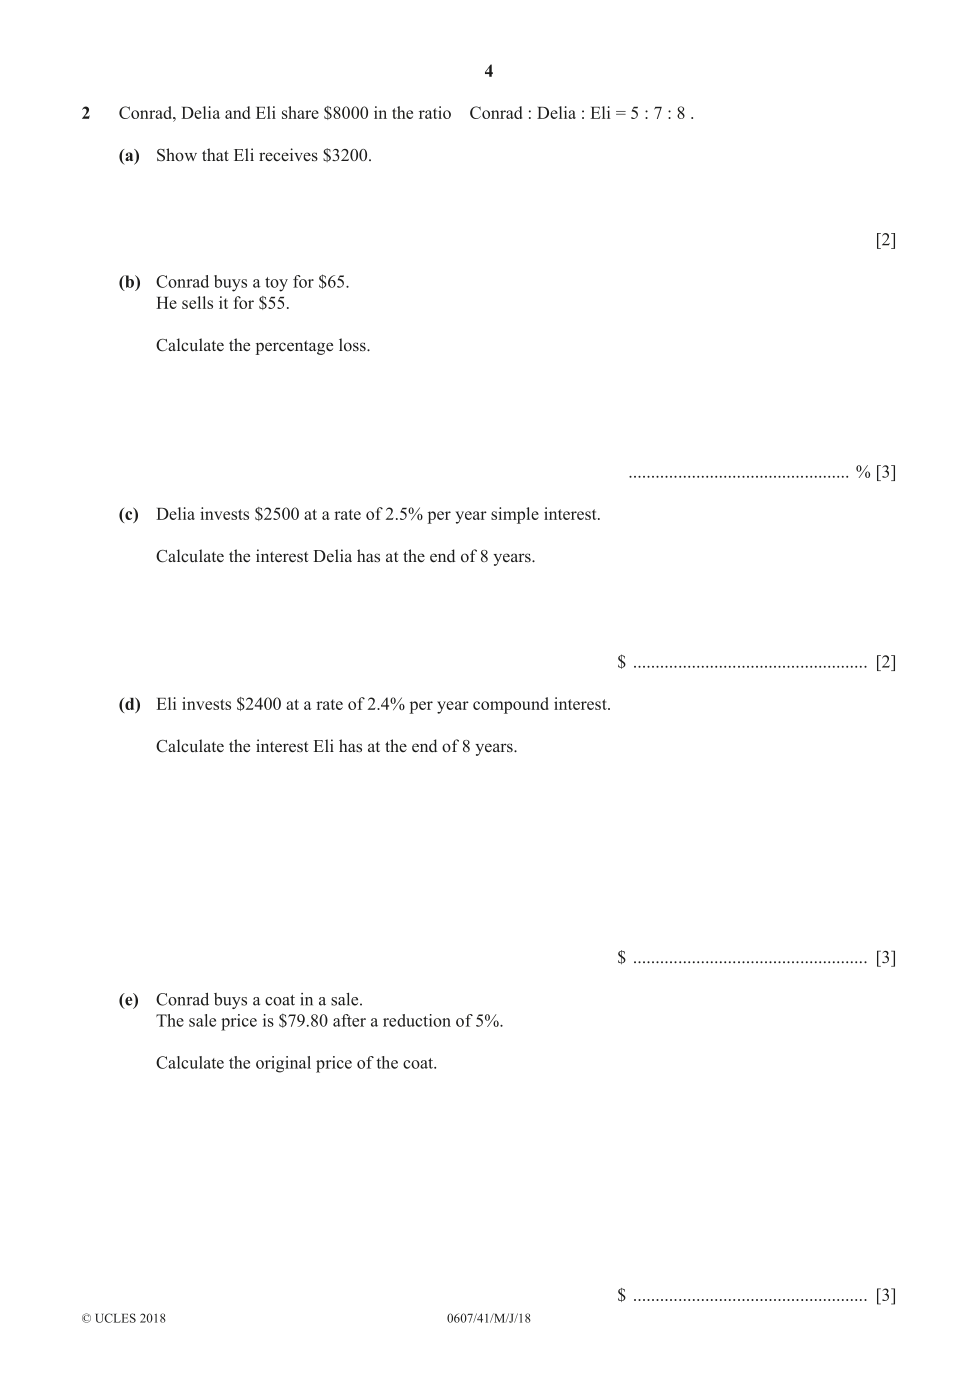
Conrad, Delia and Eli share $8000 in the ratio
Conrad : Delia : Eli = 5 : 7 : 8.
Show that Eli receives $3200.
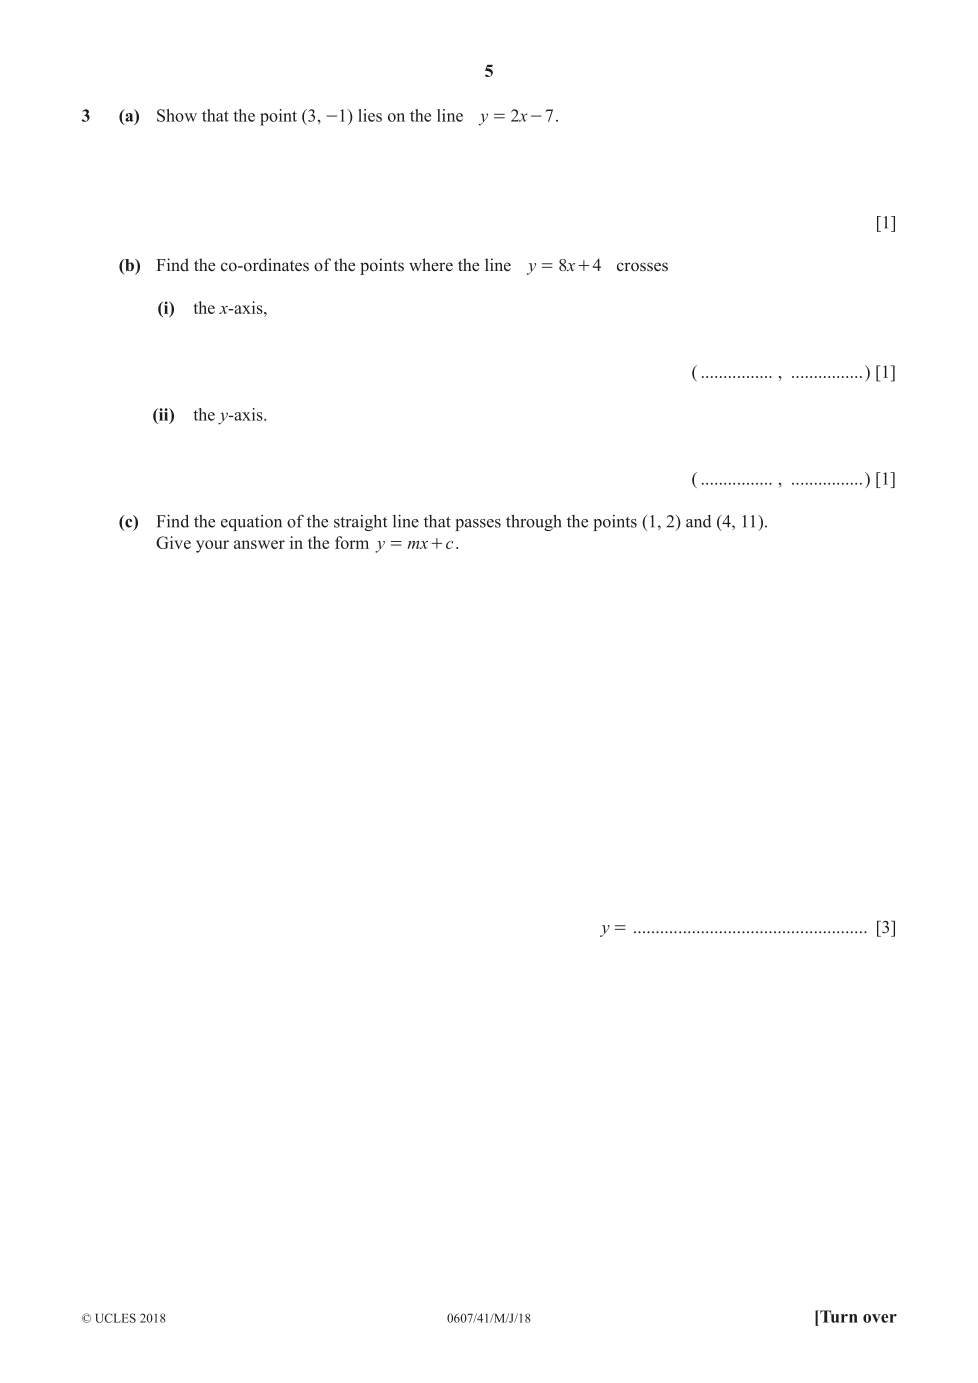
Show that the point (3, -1) lies on the line y = 2x - 7.
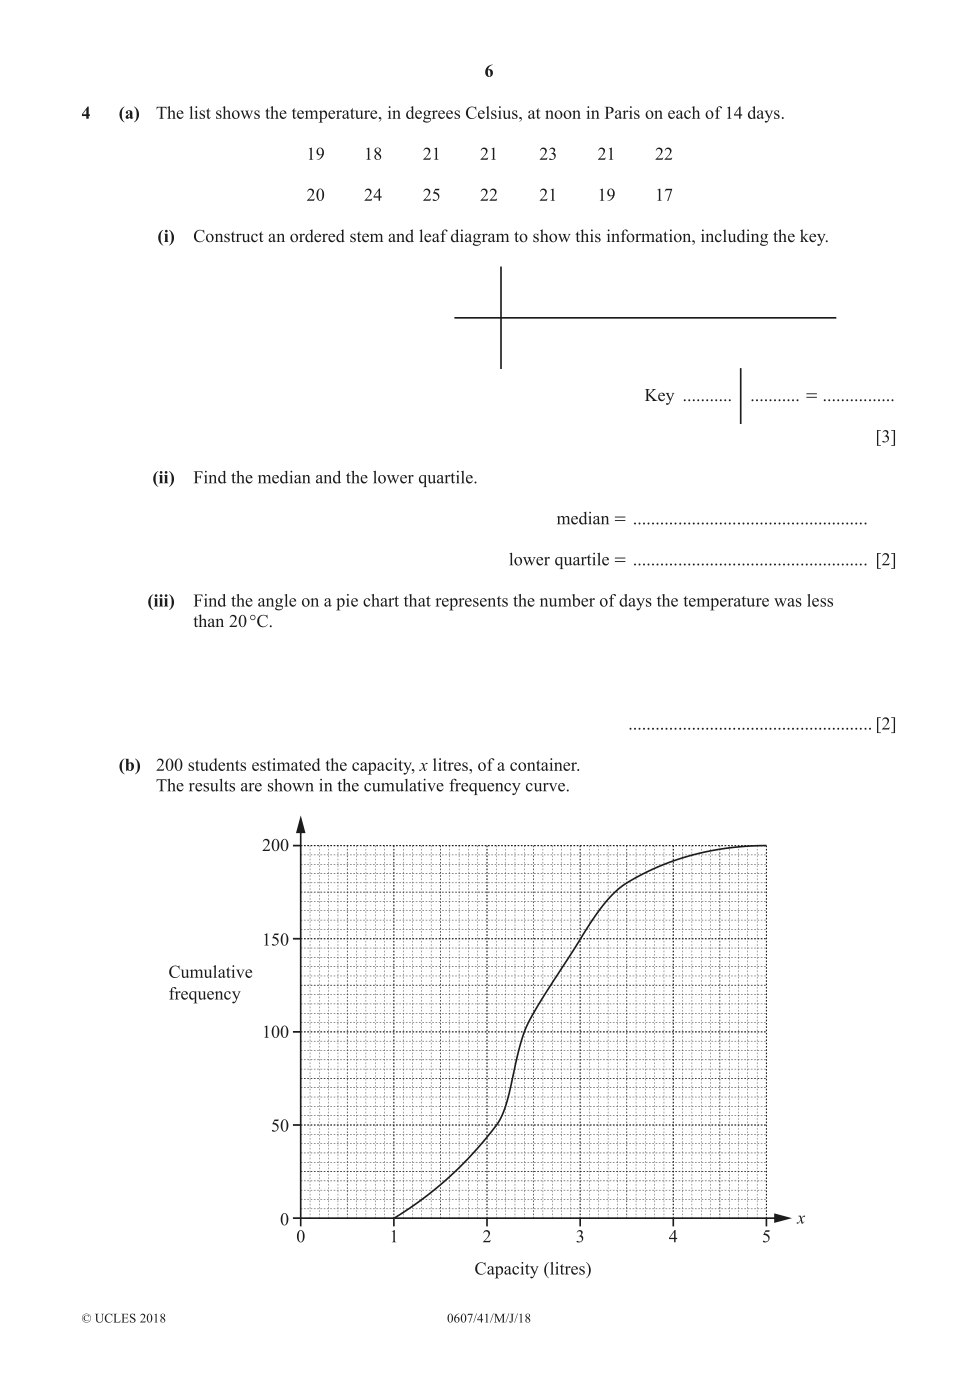
median =
lower quartile =
Find the angle on a pie chart that represents the number of days the temperature was less than 20°C.
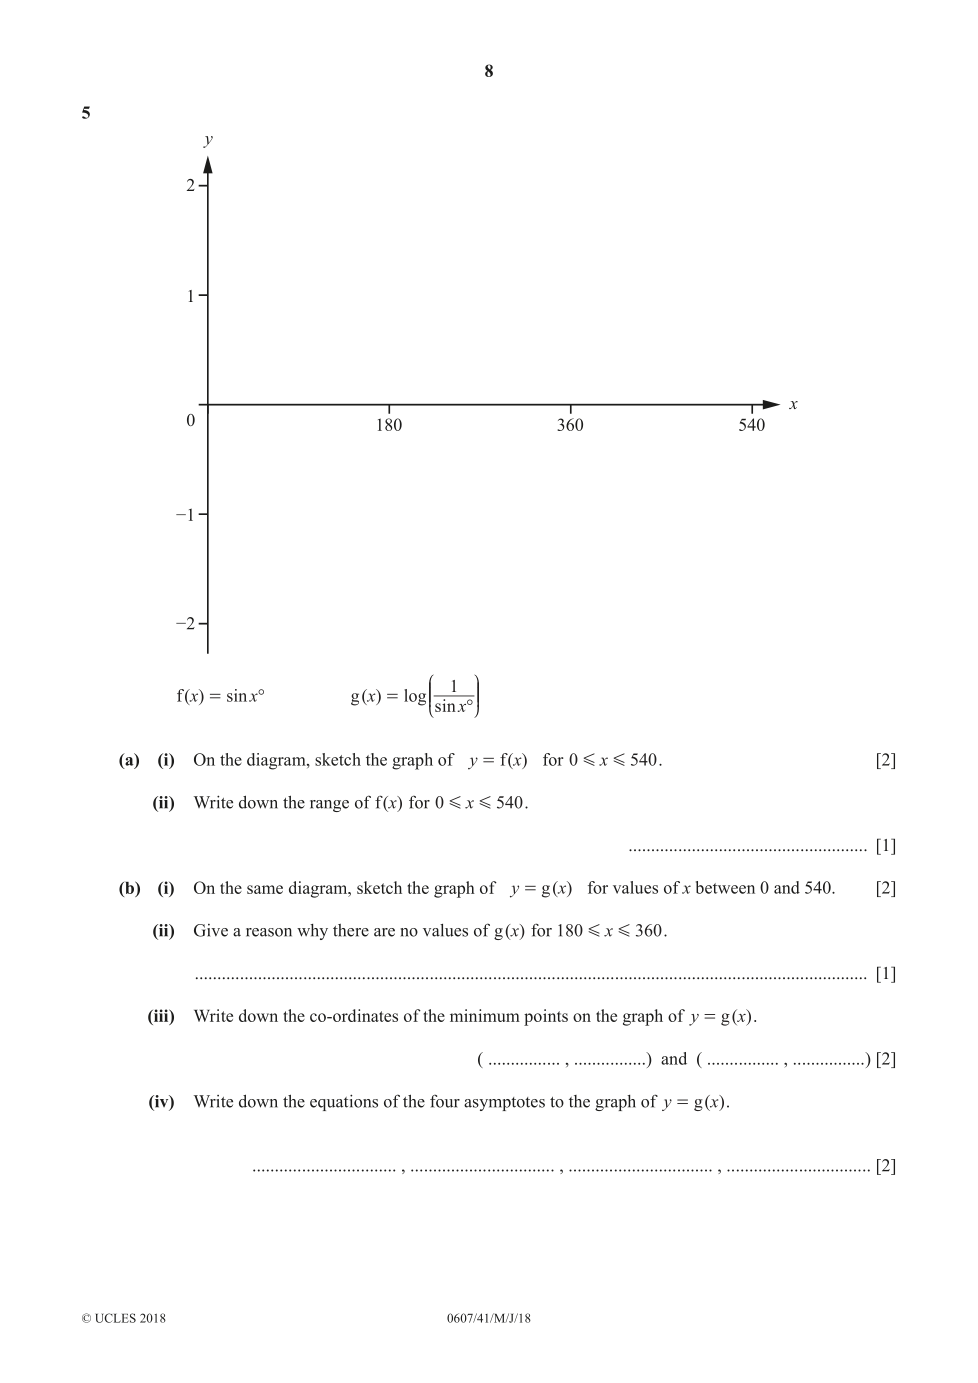
On the diagram, sketch the graph of y = f(x)
for 0 ≤ x ≤ 540.
n =

h(x) =

Sketch the graph of y = g(x) for values of x between 0 and 540.