Intro to Quadratic Functions
Sort each statement into agree or disagree (based on the graph above)
Sort each statement into agree or disagree (based on the graph above)
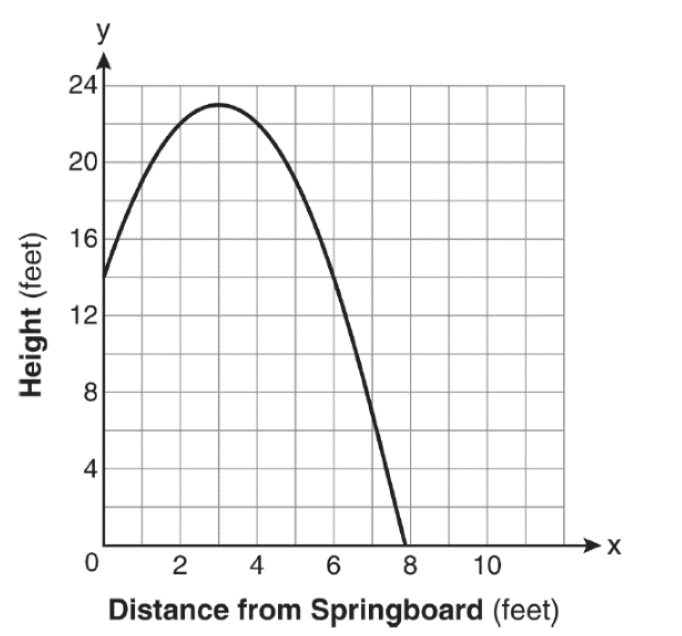
The diver’s height was
decreasing the entire time.
The springboard was 14 feet high.
The diver reached her
maximum height at 23 feet in the air.
The diver landed in the water about 14 feet away from the springboard.
The diver’s range was between 0 and 23 feet.
The diver is going up in the air
between 0 < x < 3.
The diver was 4 feet away from the springboard when she reached her maximum height.
Between 3 feet from the springboard and 8 feet from the springboard, the diver’s height was decreasing.
When the diver was 5 feet away from the springboard, she was 19 feet high.
Using the graph, f(2) = 22.
The diver was again at the height of the springboard 6 feet away from the board.
The diver’s height was changing at a faster rate between 4 feet and 6 feet from the springboard versus 6 feet and 8 feet from the springboard.
Agree
Disagree