Log in
Sign up for FREE
arrow_back
Library

AP Stats 3.1 Quiz

star
star
star
star
star
Last updated over 5 years ago
10 questions
Note from the author:
3
1
1
1
2
1
1
1
1
1
The Practice of Statistics, 4th Edition, 3.1 Quiz
Question 1
1.

Question 2
2.

Question 3
3.

Below is a scatterplot relating systolic blood pressure and age for 14 men from 42 to 67 years old. Use the scatterplot to answer questions #4-10.
Question 4
4.

Question 5
5.

Does the scatterplot show an association? If so, explain the association.

Question 6
6.

Question 7
7.

Question 8
8.

There is one “unusual point” on the graph. Explain what is “unusual” about this subject.

Question 9
9.

Question 10
10.

Select ALL that apply. You can describe the overall pattern of a scatterplot by the… 
Strength
Form
Shape
Direction
What does correlation measure? 
Strength
Shape
Form
Direction
correlation is NON-resistant to extreme observations
True
False
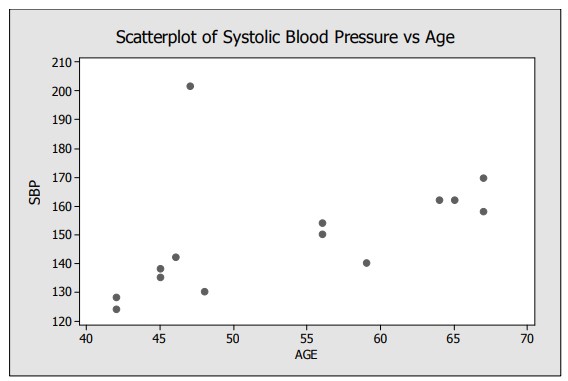
Is there a clear explanatory variable and response variable in this setting?
Yes, the explanatory variable is Age and the response variable is Systolic Blood Pressure (SBP)
Yes, the explanatory variable is Systolic Blood Pressure (SBP) and the response variable is Age
No , the scatterplot does not show a clear explanatory and response variable
What is the form of the relationship?
Exponential
Linear
Quadratic
Difficult to tell from the scatterplot
Which of the following is closest to the correlation between systolic blood pressure and age for this group of 14 men? Explain your reasoning where it says "Show your work"
r=0.2
r=0.5
r=-0.5
r=-0.2
r-=0.9
What effect would removing the “unusual point” have on the correlation?
Removing the unusual point would not change anything.
Removing the unusual point would make the correlation stronger with an r value closer to 1
Removing the unusual point would make the correlation weaker with an r value closer to 0
Removing the unusual point would make the correlation stronger with an r value closer to -1
Suppose we rescaled the ages so that they were expressed as number of years above (+) or below (–) 50 years old. That is, suppose we subtract 50 from each value. How would the correlation change? Explain
The correlation value of r would increase, closer to 1, making it stronger
The correlation value of r would decrease closer to -1, making it stronger
The unit of measurement for the value of r would change to pounds as well
The value of r would not be affected by the subtraction