Chapter 3 Practice Test
star
star
star
star
star
Last updated over 5 years ago
14 Nsɛmmisa
Hyɛ no nsow a efi ɔkyerɛwfo no hɔ:
The Practice of Statistics, 4th Edition, a combination of Exams A,B & C
1
1
1
1
1
1
1
1
1
1
4
1
2
1
The Practice of Statistics, 4th Edition, a combination of Exams A,B & C
A community college announces that the correlation between college entrance exam grades and scholastic achievement was found to be –1.08. On the basis of this you would tell the college that
In a statistics course, a linear regression equation was computed to predict the final-exam score from the score on the first test. The equation was yˆ = 10 + 0.9x where y is the final exam score and x is the score on the first test. Brenda scored 95 on the first test. What is the predicted value of her score on the final exam?
In the course described above, Carlos scored a 90 on the first test and a 93 on the final exam. What is the value of his residual?
(a) –2.0 (b) 2.0 (c) 3.0 (d) 93 (e) none of these
All but one of the following statements contains an error. Which statement could be correct?
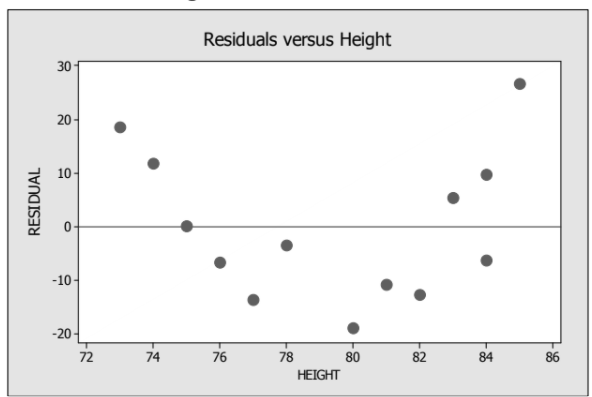
What does the residual plot tell you about the linear model?
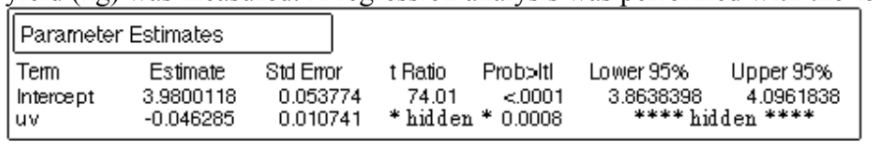
One concern about the depletion of the ozone layer is that the increase in ultraviolet (UV) light will decrease crop yields. An experiment was conducted in a green house where soybean plants were exposed to varying levels of UV, measured in Dobson units. At the end of the experiment the yield (kg) was measured. A regression analysis was performed with the following results:
Which of the following is correct?
Which statements below about least-squares regression are correct?
I. Switching the explanatory and response variables will not change the least-squares regression line.
II. The slope of the line is very sensitive to outliers with large residuals.
III. A value of r2 close to 1 does NOT guarantee that the relationship between the variables is linear.
An agricultural economist says that the correlation between corn prices and soybean prices is r = 0.7. This means that
A copy machine dealer has data on the number of copy machines x at each of 89 customer locations and the number of service calls in a month y at each location. Summary calculations are given below. What is the slope of the least-squares regression line of number of service calls on number of copiers?
In the setting of the previous problem, about what percent of the variation in the number of service calls is explained by the linear relation between number of service calls and number of machines?
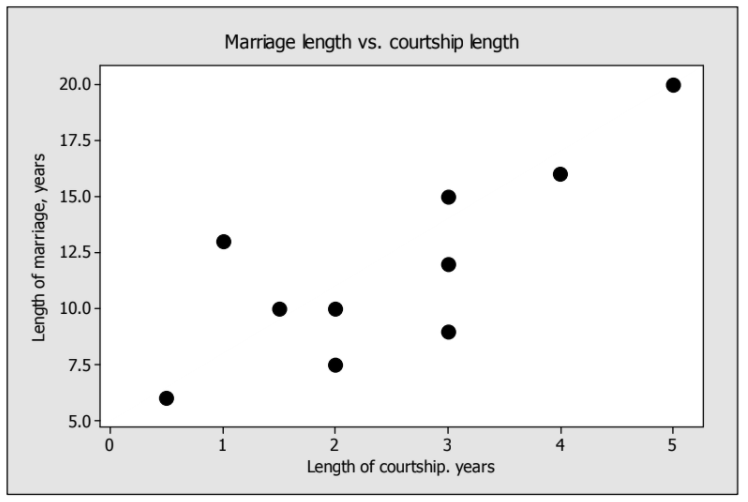
Describe what the scatterplot reveals about the relationship between length of courtship and length of marriage.
Suppose a new point at (4.5, 8), that is, years of courtship = 4.5 and years of marriage = 8, were added to the plot. What effect, if any, will this new point have on the correlation between courtship duration and marriage duration? Explain.
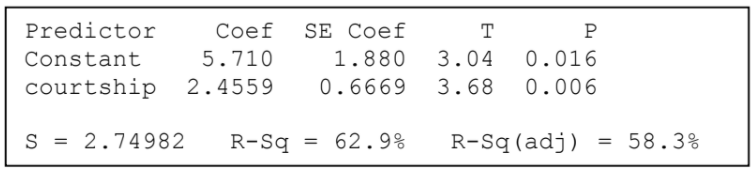
What is the slope of the regression line? Interpret the slope in the context of this problem.
Explain what the quantity S = 2.74982 measures in the context of this problem.