LRIS 9.1 Assignment
star
star
star
star
star
Posljednje ažuriranje over 5 years ago
11
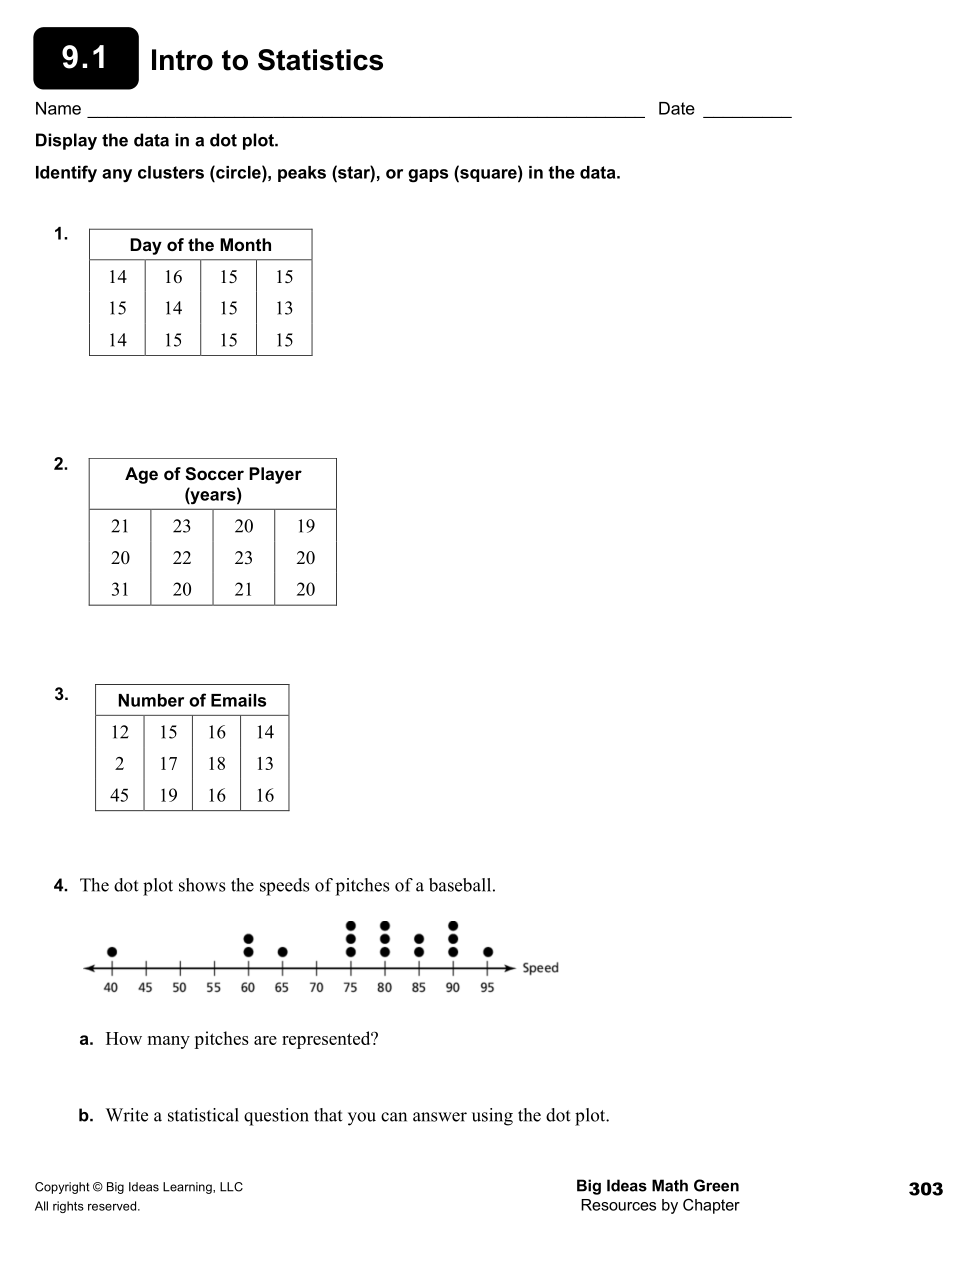
Identify the CLUSTER of this data. Click on ALL the numbers that are in the cluster.
Identify the PEAK(S) of this data. Click on ALL the numbers that are in the peak.
Identify the GAP(S) of this data. Click on ALL the numbers that are in the gaps.
Identify the CLUSTER of this data. Click on ALL the numbers that are in the cluster.
Identify the PEAK(S) of this data. Click on ALL the numbers that are in the peak.
Identify the GAP(S) of this data. Click on ALL the numbers that are in the gaps.
Identify the CLUSTER of this data. Click on ALL the numbers that are in the cluster.
Identify the PEAK(S) of this data. Click on ALL the numbers that are in the peak.
Identify the GAP(S) of this data. Click on ALL the numbers that are in the gaps.
How many pitches are represented? Type the number of pitches here.
Write a statistical question that you can answer using the dot plot.