AP Statistics Chapter 3 TEST
star
star
star
star
star
Posljednje ažuriranje over 5 years ago
14
Napomena autora:
Based on The Practice of Statistics, 4th edition teacher resources. Some questions were adjusted/modified.
1
1
1
1
1
1
1
1
1
1
4
2
2
2
Based on The Practice of Statistics, 4th edition teacher resources. Some questions were adjusted/modified.
You have data for many families on the parents’ income and the years of education their eldest child completes. Your initial examination of the data indicates that children from wealthier families tend to go to school for longer. When you make a scatterplot,
The correlation between the heights of fathers and the heights of their (fully grown) sons is r = 0.52. This value was based on both variables being measured in inches. If fathers' heights were measured in feet (one foot equals 12 inches), and sons' heights were measured in furlongs (one furlong equals 7920 inches), the correlation between heights of fathers and heights of sons would be
Lorena is 22.5 months old. What is her predicted height?
Jonathan is 20 months old and is 75 centimeters tall. What is his residual?
Which of the following statements is/are true?
I. Correlation and regression require that there are clearly-identified explanatory and response variables.
II. Scatterplots require that both variables be quantitative.
III. Every least-squares regression line passes through
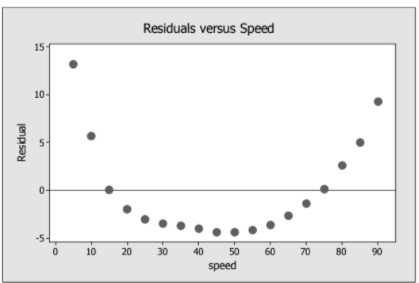
What does the residual plot tell you about the linear model?
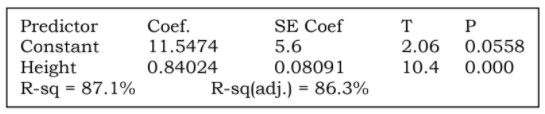
Leonardo da Vinci, the renowned painter, speculated that an ideal human would have an armspan (distance from the outstretched fingertip of the left hand to the outstretched fingertip of the right hand) that was equal to his height. The following computer regression printout shows the results of a least-squares regression of armspan on height, both in inches, for a sample of 18 high school students.
Which of the following statements is false?
A study found correlation r=0.61 between the sex of a worker and his or her income. From this information, we can conclude that...
Which of the following statements about the correlation r are true?
I. The correlation and the slope of the regression line have the same sign
II. A correlation of -0.35 and a correlation of 0.35 show the same degree of association about the regression line
III. A correlation of 0.75 indicates a relationship is 3 times as linear as one for which the correlation is only 0.25
A copy machine delader has data on the number x of copy machines at each of 89 customer locations and the number y of service calls in a month at each location. Summary calculations give the data below. What is the y intercept of the least-squares regression line of number of service calls on number of copiers?
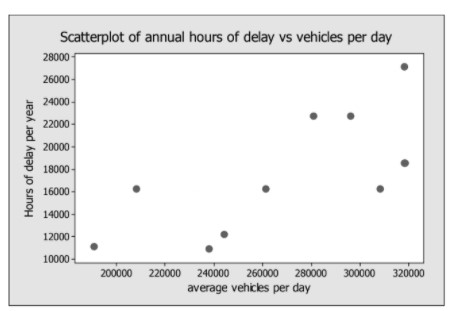
Describe what the scatterplot reveals about the relationship between traffic delays and number of cars on the road.
Suppose another data point at (200000, 24000), that is 200,000 vehicles per day and 24,000
hours of delay per year, were added to the plot. What effect, if any, will this new point have
on the correlation between these two variables? Explain.
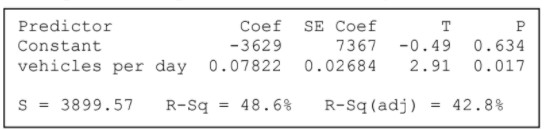
What is the slope of the regression line? Interpret the slope in the context of this problem.
Explain what the quantity S = 3899.57 measures in the context of this problem.