LRIS 10.2 Assignment GREY
star
star
star
star
star
Last updated over 5 years ago
6 Nsɛmmisa
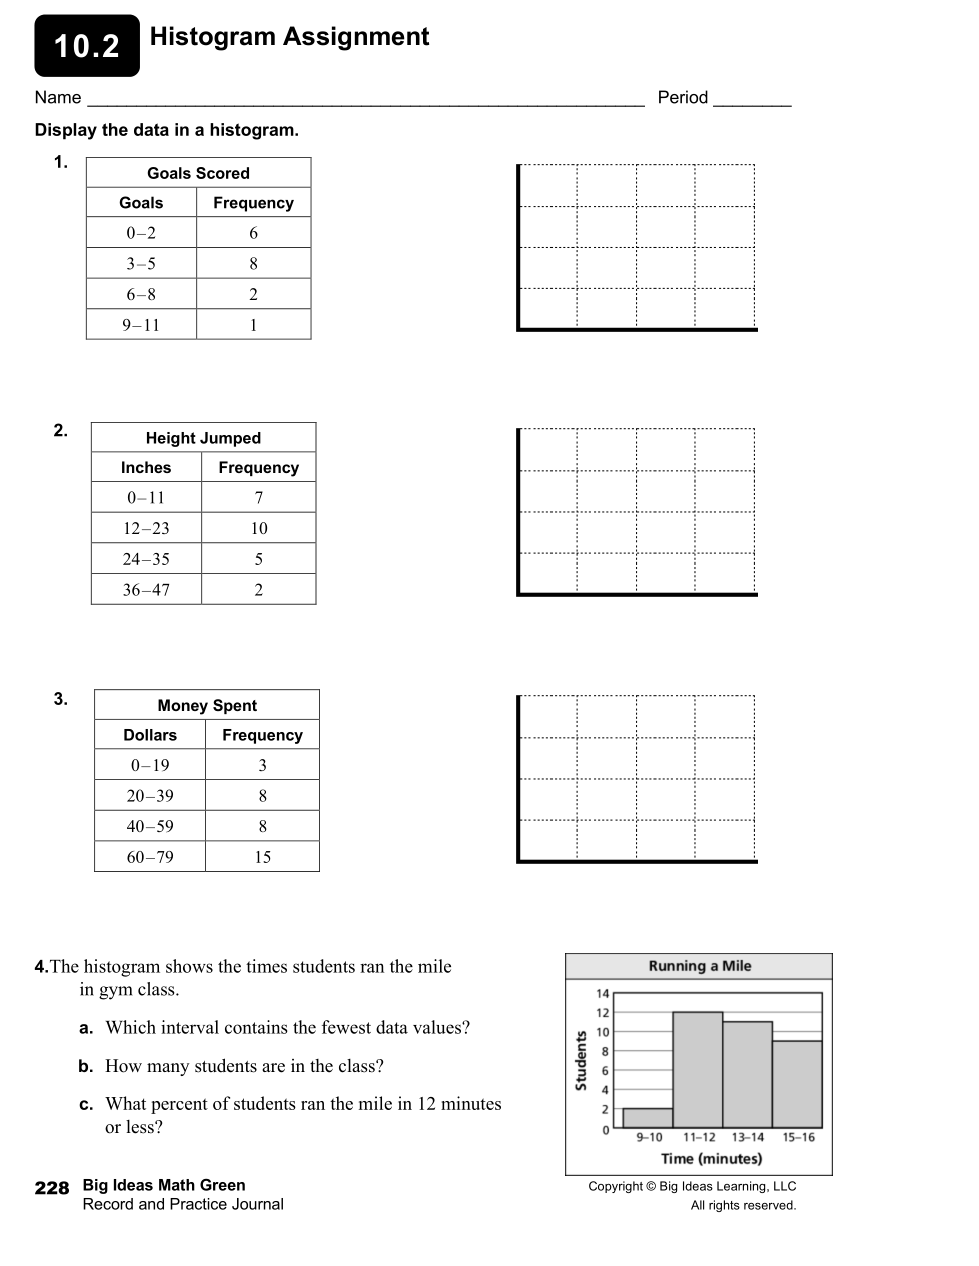
Display the data in a histogram.
Click on I've created the histogram when finished.
Display the data in a histogram.
Click on I've created the histogram when finished.
Display the data in a histogram.
Click on I've created the histogram when finished.
Which interval contains the fewest data values?
How many students are in the class?
What percent of students ran the mile in 12 minutes or less?