LRIS 10.4 Assignment TAN
star
star
star
star
star
Last updated over 5 years ago
11 Nsɛmmisa
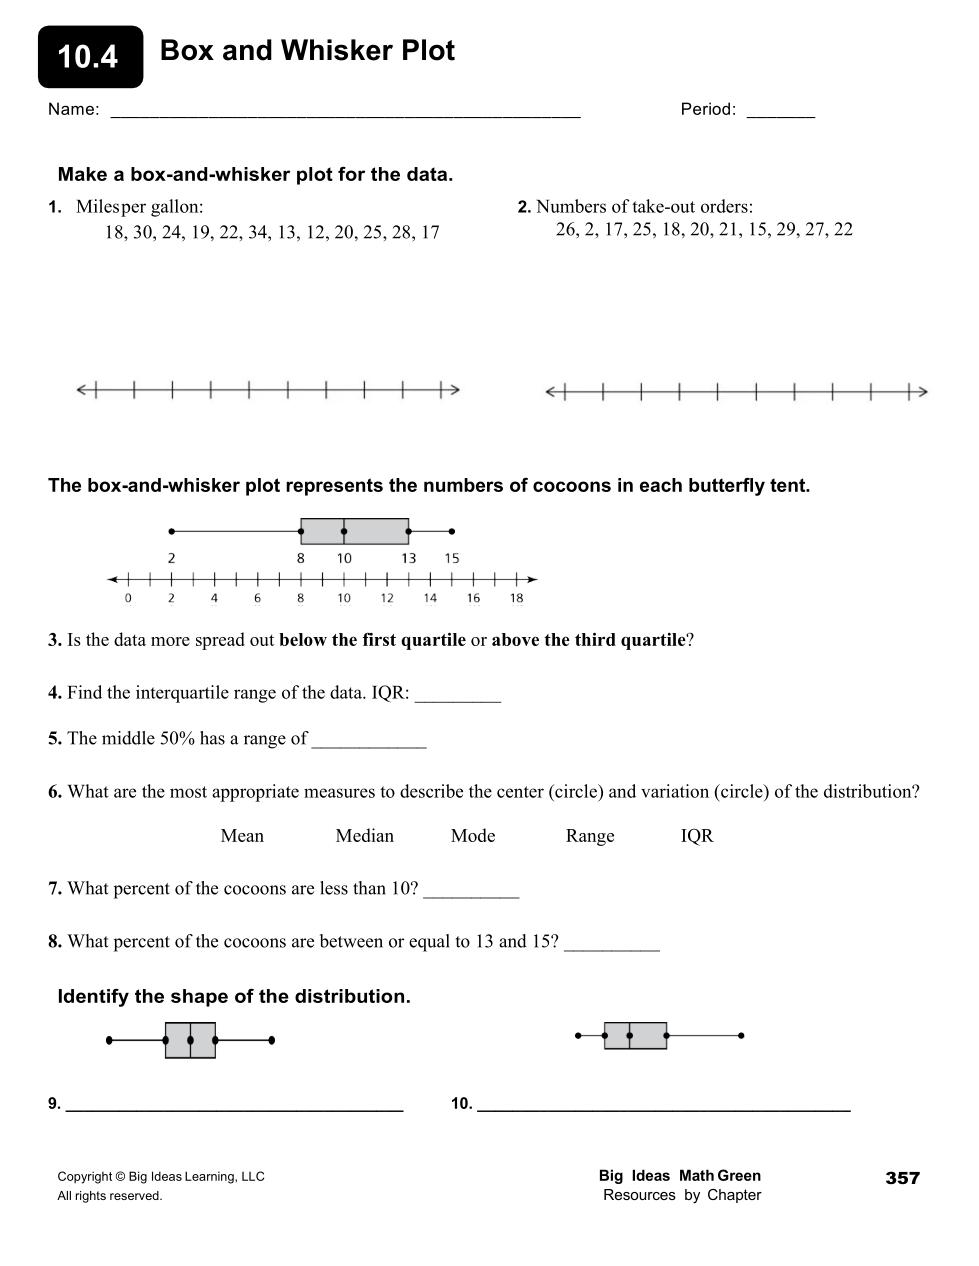
Make a box-and-whisker plot for the data.
Make a box-and-whisker plot for the data.
Is the data more spread out below the first quartile or above the third quartile?
Find the interquartile range (IQR) of the data.
The middle 50% has a range of ______.
What are the most appropriate measures to describe the center of the distribution?
What are the most appropriate measures to describe the variation of the distribution?
What percent of the cocoons are less than 10?
What percent of the cocoons are between or equal to 13 and 15?
Identify the shape of the distribution.
Identify the shape of the distribution.