LRIS Units 9 & 10 Quiz
star
star
star
star
star
Last updated over 5 years ago
20 Nsɛmmisa
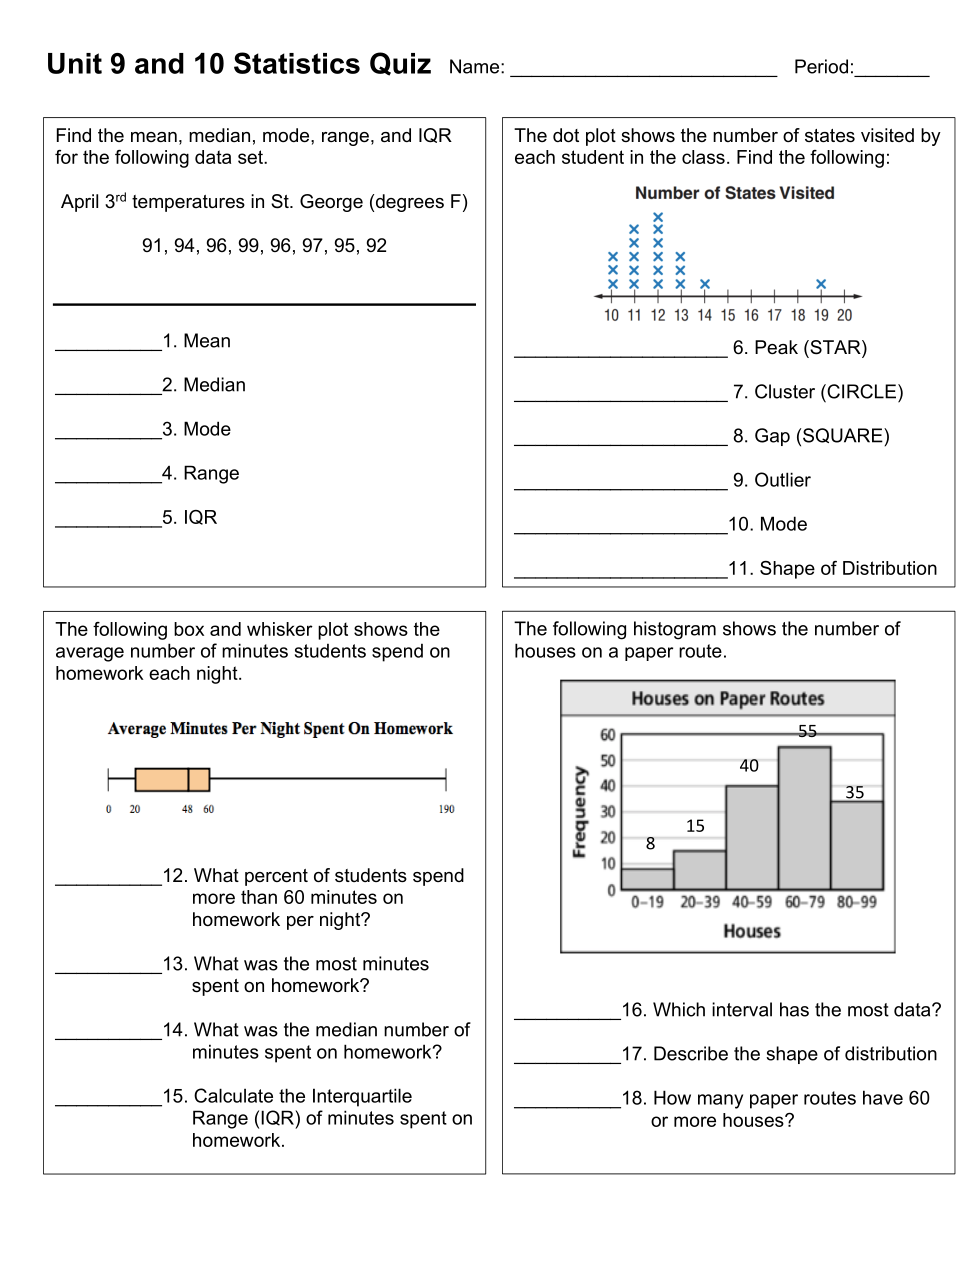
What is the median of the data?
What is the mean of the data?
What is the mode of the data?
What is the range of the data?
What is the interquartile range (IQR) of the data?
What is the peak of the data?
Select ALL that are.
Where is the cluster of the data?
Select ALL that are in the cluster.
Where is the gap of the data?
Select ALL that are inside the gap.
Which number or numbers would be the outlier(s)?
Select ALL that are outliers.
What is the mode of this data?
What is the shape of the distribution of data?
What percent of students spend more than 60 minutes on homework per night?
What was the most minutes spent on homework?
What was the median number of minutes spent on homework?
Calculate the interquartile range (IQR) of minutes spent on homework.
Which interval has the most data?
Describe the shape of the distribution.
How many paper routes have 60 or more houses?
Did you remember to put your name and your period number on your paper?
Do you have any missing assignments for this unit (9 & 10)?
Type either "yes" or "no".