LRIS Unis 9 & 10 Review
star
star
star
star
star
Posljednje ažuriranje over 5 years ago
22 questions
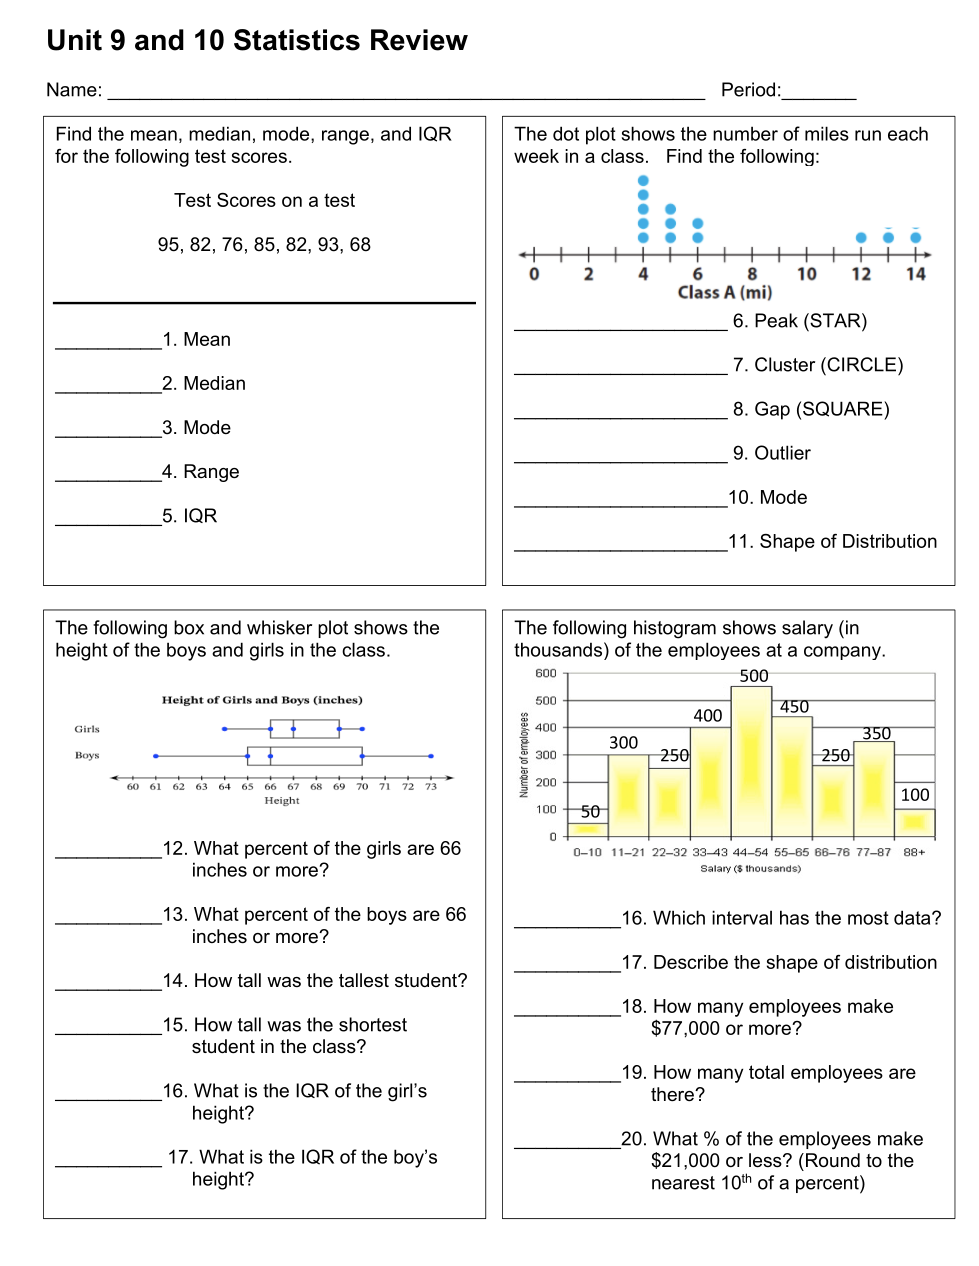
What is the mean?
What is the median?
What is the mode?
What is the range?
What is the interquartile range?
What is the peak?
Where is the cluster?
Click on all that are in the cluster.
Where is the gap?
Click on all that are in the gap.
Where are the outliers?
Click on all that are in the gap.
What is the mode?
What is the shape of this distribution?
What percent of the girls are 66 inches or more?
What percent of the boys are 66 inches or more?
How tall was the tallest student?
How tall was the shortest student in the class?
What is the IQR of the girl's height?
What is the IQR of the boy's height?
Which interval has the most data?
Describe the shape of distribution.
How many employees make $77,000 or more?
How many total employees are there?
What % of the employees make $21,000 or less?
Round to the nearest 1/10 of a percent.