Twa kɔ nsɛm atitiriw so
Log in
Sign up for FREE
arrow_back
Laabri

APS1-1 Displaying Data

star
star
star
star
star
Last updated about 5 years ago
13 Nsɛmmisa
1
1
1
1
1
1
1
1
1
1
1
1
0
Asemmisa {{asɛmmisaAhyɛnsode}}
1.

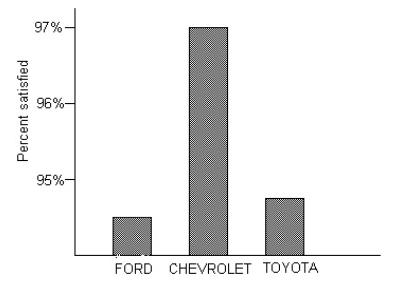
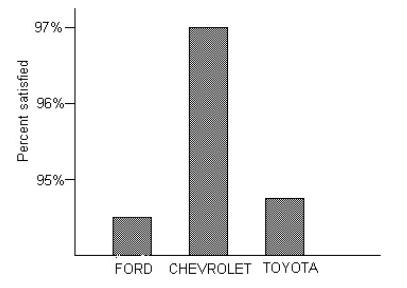
The following bar graph gives the percent of owners of three brands of trucks who are satisfied with their truck. From this graph, we may conclude that
Asemmisa {{asɛmmisaAhyɛnsode}}
2.

I stole this question from someone else's practice test. Their answer on #1 was that "a pie chart would have been a better choice for displaying these data." Explain why that is not correct.

Asemmisa {{asɛmmisaAhyɛnsode}}
3.

Why is the bar chart in #1 misleading?

Asemmisa {{asɛmmisaAhyɛnsode}}
4.

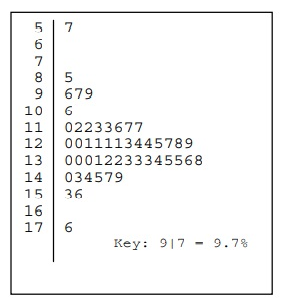
The population of the United States is aging, though less rapidly than in other developed countries. Below is a stemplot of the percents of residents aged 65 and older in each of the 50 states, according to the 2000 census. There are two outliers: Alaska has the lowest percent of older residents, and Florida has the highest. What is the percent for Florida?

Asemmisa {{asɛmmisaAhyɛnsode}}
5.

The population of the United States is aging, though less rapidly than in other developed countries. Below is a stemplot of the percents of residents aged 65 and older in each of the 50 states, according to the 2000 census. Show how you would determine the median, lower and upper quartiles, and IQR, and describe how you would check the data for outliers. (you may need to zoom in)

Asemmisa {{asɛmmisaAhyɛnsode}}
6.

The Interquartile range for the distribution of 50 states in the previous question is:

Asemmisa {{asɛmmisaAhyɛnsode}}
7.

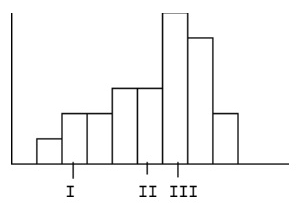
For the histogram below, what is the proper ordering of the mean and median? Note that the graph is NOT numerically precise—only the relative positions are important.

Asemmisa {{asɛmmisaAhyɛnsode}}
8.

If a distribution is skewed to the right, which of the following is true?

Asemmisa {{asɛmmisaAhyɛnsode}}
9.

If you are given only summary statistics (mean, sd, median, quartiles, minimum, and maximum), describe how you know if data is skewed or symmetric.

Asemmisa {{asɛmmisaAhyɛnsode}}
10.

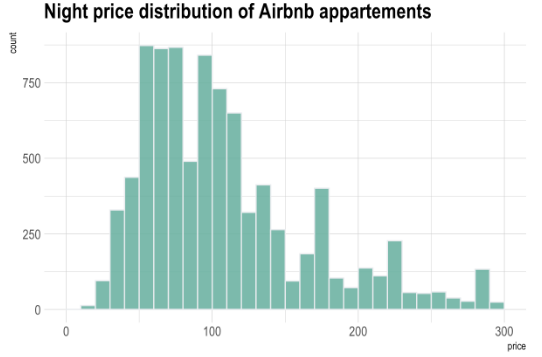
Describe the histogram below. Remember to address shape, center, and spread.

Asemmisa {{asɛmmisaAhyɛnsode}}
11.

How can you tell the difference between a histogram and a bar chart? What are the important differences?

Asemmisa {{asɛmmisaAhyɛnsode}}
12.

What are the differences and similarities between a stemplot and a histogram?

Asemmisa {{asɛmmisaAhyɛnsode}}
13.

Are there any questions that came up that you would like me to go over in class?