14.1 Scatter Plots and Association
star
star
star
star
star
Posljednje ažuriranje over 5 years ago
11
1
1
1
1
1
1
1
1
1
1
1

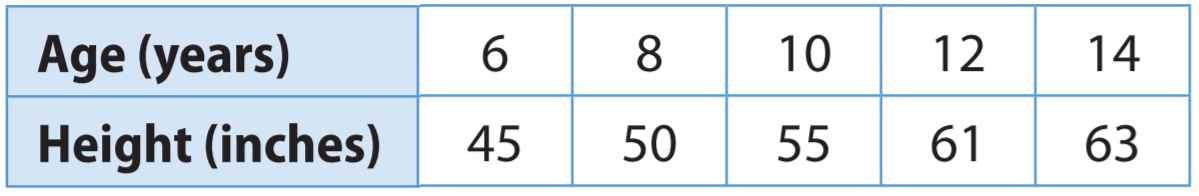
Make a scatter plot of Bob's data.
What is the association between Bob's age and his height?
The scatter plot shows the basketball shooting results for 14 players.


What type of association is the scatter plot?
Circle any clusters.
Circle any outliers.
What is the coordiate of the outlier?
Make a scatter plot from the following data.

What type of association is the scatter plot?
The data below represents the number of registers at grocery stores and the number of minutes shoppers wait until scanning the groceries.

Make a scatter plot of the data.
What type of association is the scatter plot?
Give the coordinate of any outlier.