FRQ Quantitative Analysis TEACHER MODEL
star
star
star
star
star
Last updated over 5 years ago
5 Nsɛmmisa
Hyɛ no nsow a efi ɔkyerɛwfo no hɔ:
Quantitative Analysis Teacher model
1
1
1
1
1
Quantitative Analysis Teacher model
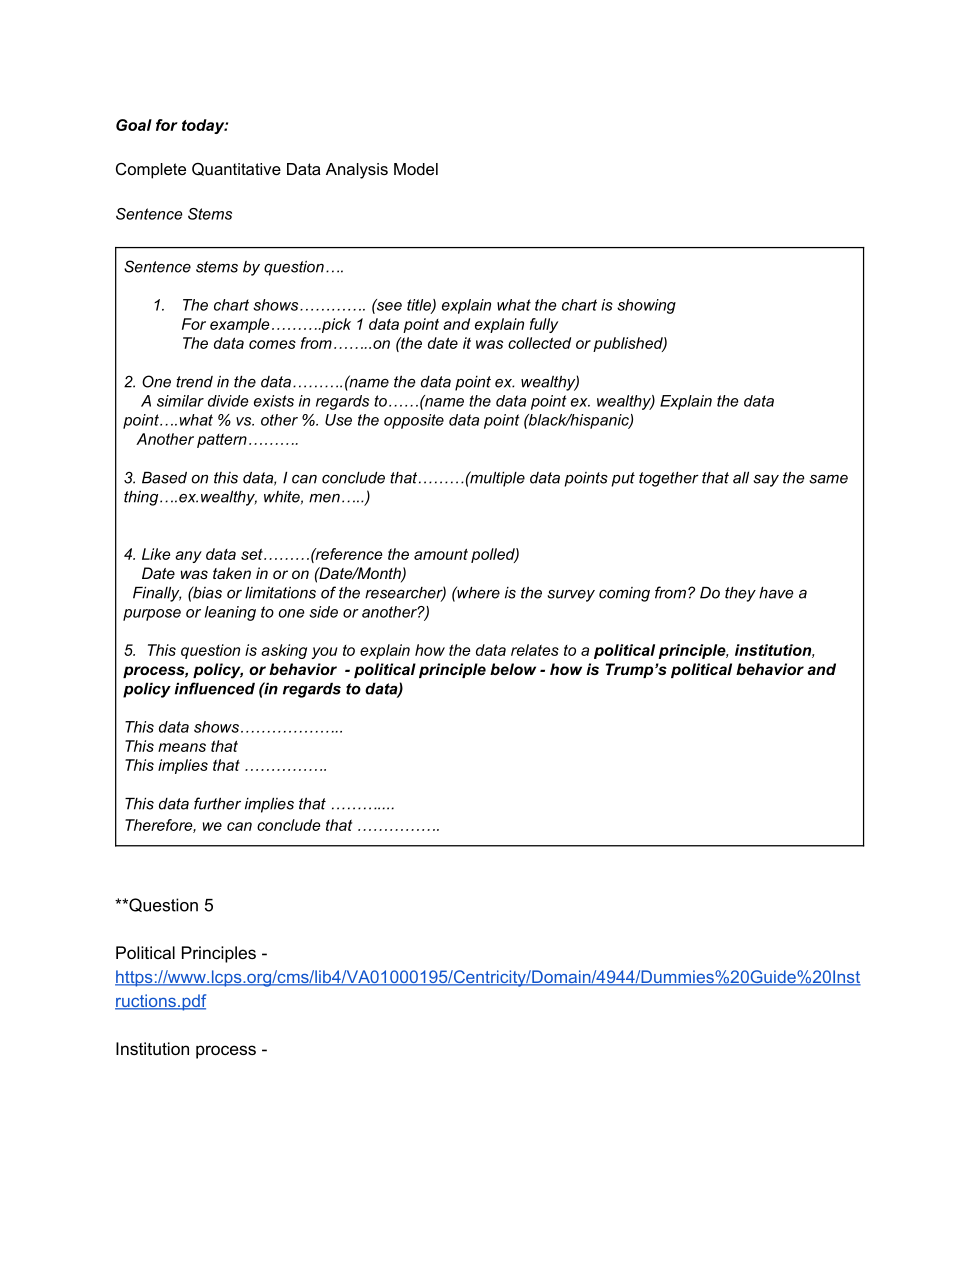
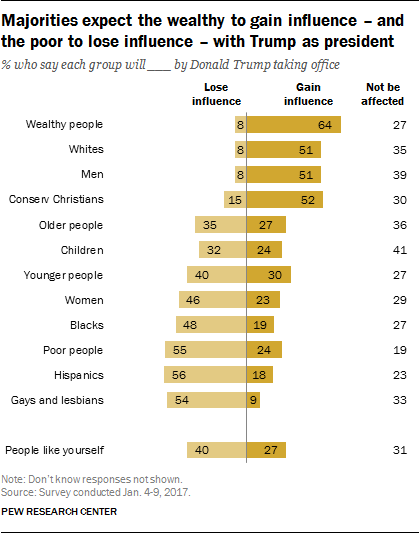
Describe the data presented in the chart.
Describe any patterns or trends in the data.
What conclusions can you draw from the data?
Does this data set have limitations? Explain.
What does this data imply about President Trump, the presidency in general, and/or politics in America?